

AUDUSD bears to make way for bullish charge
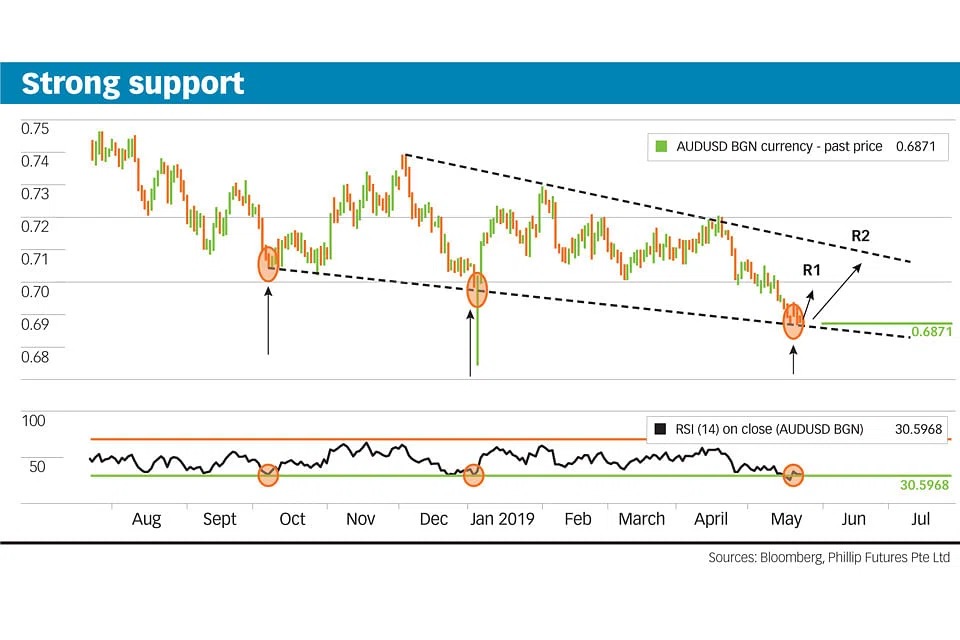
EARLIER this year in January, the AUDUSD currency pair was hit by the flash crash and plunged to its lowest levels since the global financial crisis. However, within the day, prices snapped back to normal levels and ushered in a bullish momentum which pushed the AUDUSD to the 0.7279 levels within the span of a month.
Since then, prices continued to range lower and at present seem to be sitting at the bottom of a falling wedge formation, indicating that a move higher may be imminent as it reverts to the mean.
The first key factor, which establishes 0.6861 as a bottom, is that prices have coincided with the bottom wedge line for the third time, and this validates the strength of the support along the horizontal plane.
Wedges are usually identified as a reversal pattern which forms when the price of an asset moves within a narrowing range, either angled up (Rising) or down (Falling). The pattern is completed when price breaks out and traverses in a direction opposite the wedge angle; in this example, heading upwards.
The second factor is price action. Upon reaching the support level, the formation of a smaller-bodied candlestick may be observed, with variations of completed doji patterns. This signifies uncertainty in the market (between buyers and sellers), where the prevailing direction of a trend comes to a halt.
In most cases, when this formation is observed in isolation, there is no indication where prices may move next. But when it is identified at a support line, it may then be interpreted as an exhaustion of the bears, or the growing strength of the bulls.
In this case, the use of the daily Relative Strength Index (RSI) indicator seems to work extremely well in spotting a reversion from the bottom end of the wedge when the indicator falls below 30 per cent. It may be observed on all three occasions where prices coincided with the bottom of the falling wedge that the RSI was below 30 per cent.
The RSI is a momentum indicator that measures the magnitude of recent price changes to identify overbought or oversold conditions. A reading over 70 per cent signifies an overbought condition while a reading below 30 per cent represents an oversold condition. Do note however that it is not meant to be interpreted in isolation but in tandem with other factors to attain confluence, thereby adding validity to the postulation.
Based on the formation of the descending wedge, prices are likely to encounter the first wave of selling at the psychological round number of 0.7000. The next encounter of resistance would be at the top of the wedge in the 0.7045 to 0.7075 region. Thereafter, should prices break out of both levels, they will be set to recover beyond the 0.7376 level.
Disclaimer: Chartpoint is provided by Phillip Securities Research for information only, and should not be construed as investment advice.
TRENDING NOW

Far East Organization’s The Serra Residences sells less than a quarter of units released at average S$3,460 psf

Singapore to use ‘every legal and regulatory lever’ against companies linked to haze: Shanmugam

Could stablecoins be the future of money?

The middle power moment arrives in South-east Asia – but not for Asean

