

BT Explains: How to price climate risks and opportunities

Wong Pei Ting
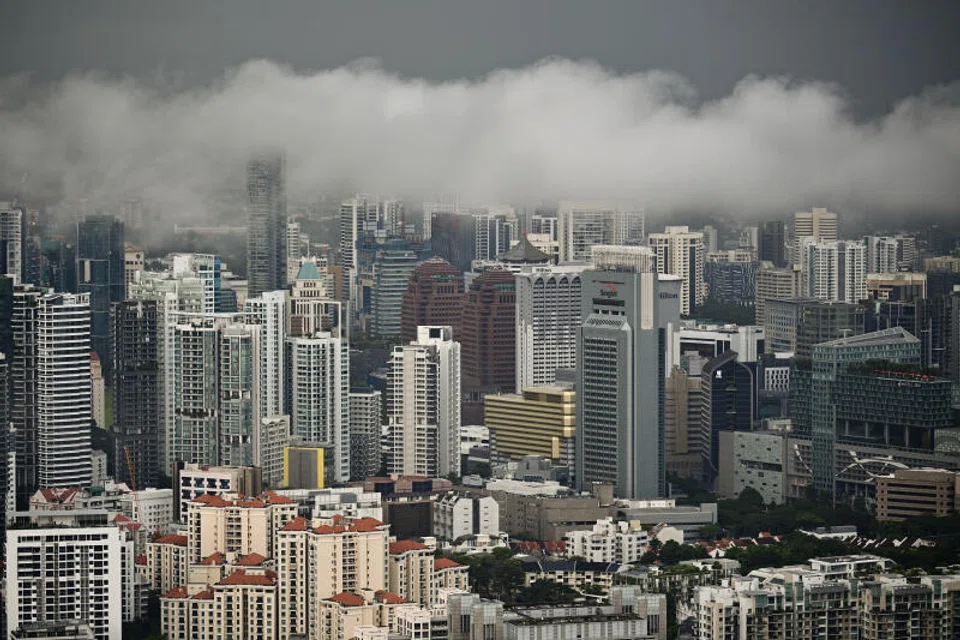
By virtue of its geographical location, Singapore's economy is expected to be the hardest hit globally if the earth warms up 3.2 degrees Celsius by mid-century.
This is according to a Swiss Re Institute study, which also projected that the island nation’s gross domestic product (GDP) may shrink up to 46.4 per cent under the scenario, while the world’s biggest polluter, China, is likely to see a 23.5 per cent fall at most.
Among regions, the most exposed is Asean - where a 37.4 per cent fall is estimated, versus a world average of 18.1 per cent. Asean is still less exposed under the more conservative 2-degree scenario.
In spite of this disproportionate impact from climate change, there remains little awareness among companies in this region of how to put a number to such risks and where the opportunities might be.
Among companies that do make an effort to measure risks, meanwhile, models vary. Tsinghua University’s Centre for Green Finance Research has collated the different methods of climate risk assessments that have emerged.
Launched at Temasek’s latest Ecosperity session on Apr 20, the report, titled Pricing climate risks in Asia, also showcased use cases and actionable insights.
These insights could be as granular as understanding that real estate in Chinese coastal cities could expect to see annual credit loss of mortgage loans trebling by 2050 under severe climate change scenarios.
The Business Times takes a look at 4 methodologies presented.
1) Scenario-based analysis
This method puts companies or sectors through stress tests under alternative climate scenarios, and is used to assess financial and reputational risks resulting from policy, legal, technology and market changes in the transition to a low-carbon economy.
It involves 4 steps: Setting climate scenarios, evaluating transition impact, analysing corporate impact, and assessing financial risk.
Case study: Coal-fired power companies in China
Step 1: The researchers chose 2 climate scenarios: A baseline scenario assuming no changes in climate measures were taken in China, and a 2-degree scenario.
Properties of the 2-degree scenario referenced projections by the International Energy Agency, which states that demand from coal-based power generation will drop nearly half by 2030 compared to the baseline scenario.
They also took guidance from the World Bank’s projections of the price of carbon, which looks set to surge to US$70 by 2030 from the current US$10, and Blomberg’s estimations of how cheap renewables would be.
Step 2: The researchers evaluate the impact of any efforts at a transition, including assessing consequent macroeconomic and sectoral impacts such as adjusted economic growth, carbon costs and renewable energy deployment.
Metrics picked in assessing the performance of coal-fired power companies under the different scenarios are changes in demand, changes in production costs and sale prices.
Step 3: The researchers incorporated climate scenarios into specific companies’ financial analyses, estimating changes to financial indicators such as net income, return on assets and debt ratios.
Researchers relied on the projected changes to the financial statements of 3 Chinese thermal power companies to understand the direct effects of climate-related transition.
Step 4: The outcomes were used as inputs or explanatory variables in established financial risk models to ascertain the impact on banks and investors. In this case, the probability of default model was used. Valuation models could be used in other cases.
Findings: Chinese thermal power companies’ likelihood of credit default could go from about 3 per cent in 2020 to 23 per cent in 2030 if global warming goes on to reach 2 degrees Celsius.
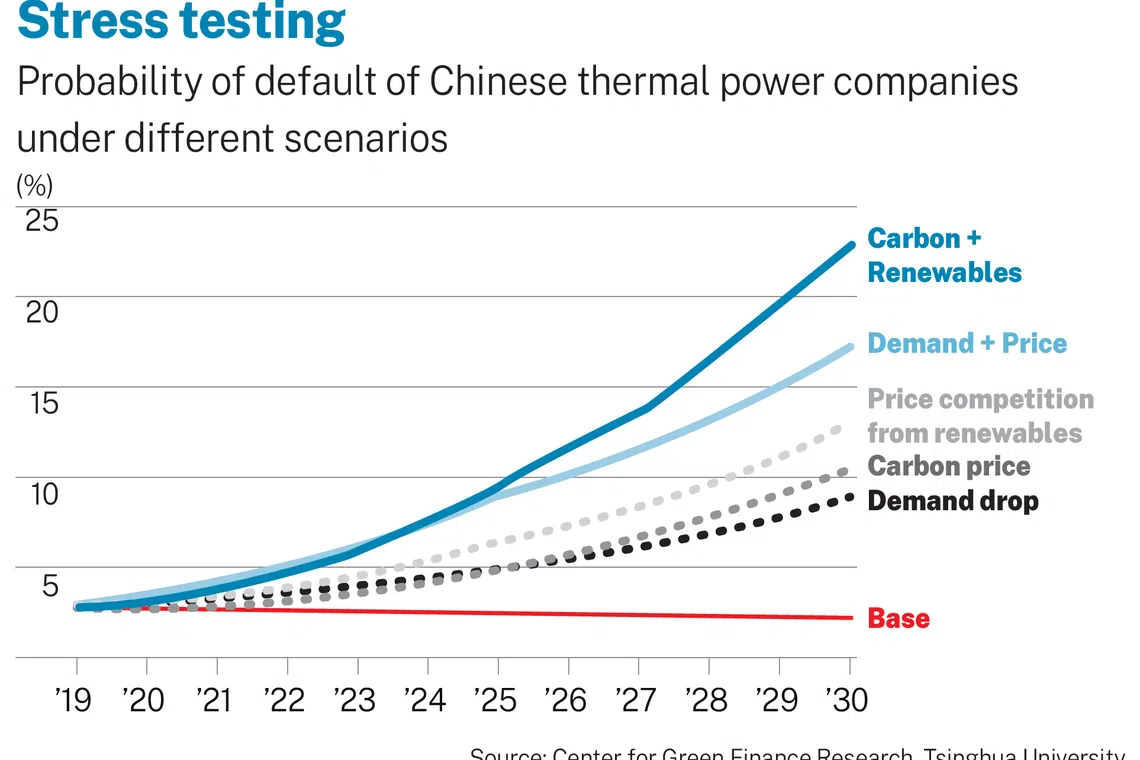
This proves that the probability of default of the sector will be “extremely high and unsustainable” in 10 years, the report stated. Price competition from renewables is expected to contribute the most to defaults.
Case study: Wind and solar power
Non-profit think tank 2 Degrees Investing Initiative (2DII) had used this method as well to assess the default probabilities of the wind and solar power sectors under a “too late, too sudden” transition scenario. The scenario assumes a “Climate Minsky” moment – a sudden adjustment of investor expectations about future climate policies and the resulting fire sale of affected assets as the risk is repriced – by 2025.
The researchers estimated the value of new equity assets using the dividend valuation model, while valuing debt assets by adjusting future cash flows based on the adjusted probability of default estimated by the Zmijewski Score bankruptcy model.
The financial indicators used to quantify the transition impact included carbon intensity of production, carbon taxes, production inputs, capital expenditure, research and development expenditure, and selling prices.
Findings: The equity value of solar photovoltaics companies will increase 19.2 per cent, while that of those doing wind electricity will increase 12.8 per cent. Therefore, annual probability of default will decrease from the baseline 2 per cent to almost zero.
2) Factor-based analysis
This method, also known as the CARIMA (carbon risk management) model, quantifies the risks and opportunities of an economy’s transition using the historical returns of global stock prices, and had been used to gauge transition risks between “green” and “brown” sectors.
Here is how it may be used:
Step 1: Consolidate a master dataset of stock values.
Step 2: Score stocks based on carbon risk proxy variables to assess whether the value of a company is influenced positively or negatively by unexpected changes in a low-carbon transition. In the use case, 55 variables were identified and classified under “value chain”, “adaptability” and “public perception” categories.
Step 3: Scores are given weight and aggregated into a single “brown-green score” to allow the classification of companies as either “brown” or “green”.
The results are used to calculate what is called the “Carbon Risk Factor Brown Minus Green”. Think of this figure as a hypothetical portfolio that longs “brown” stocks and shorts “green” stocks. It reflects the return difference between “brown” and “green” stocks.
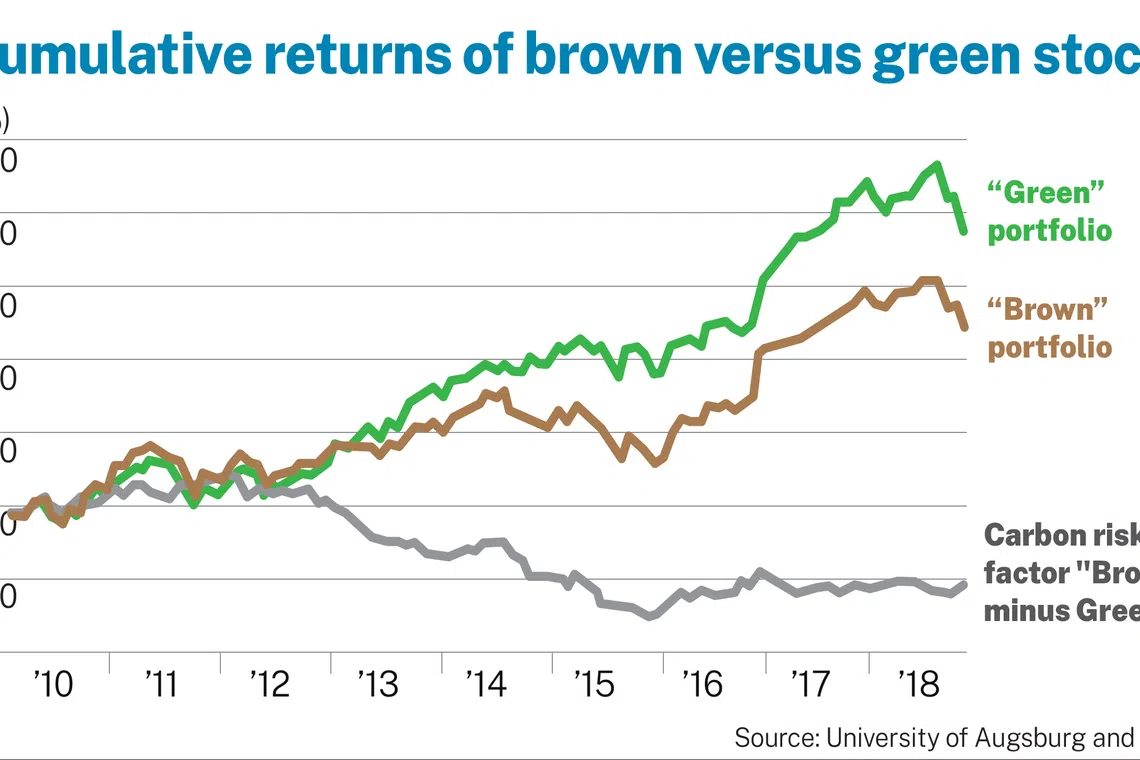
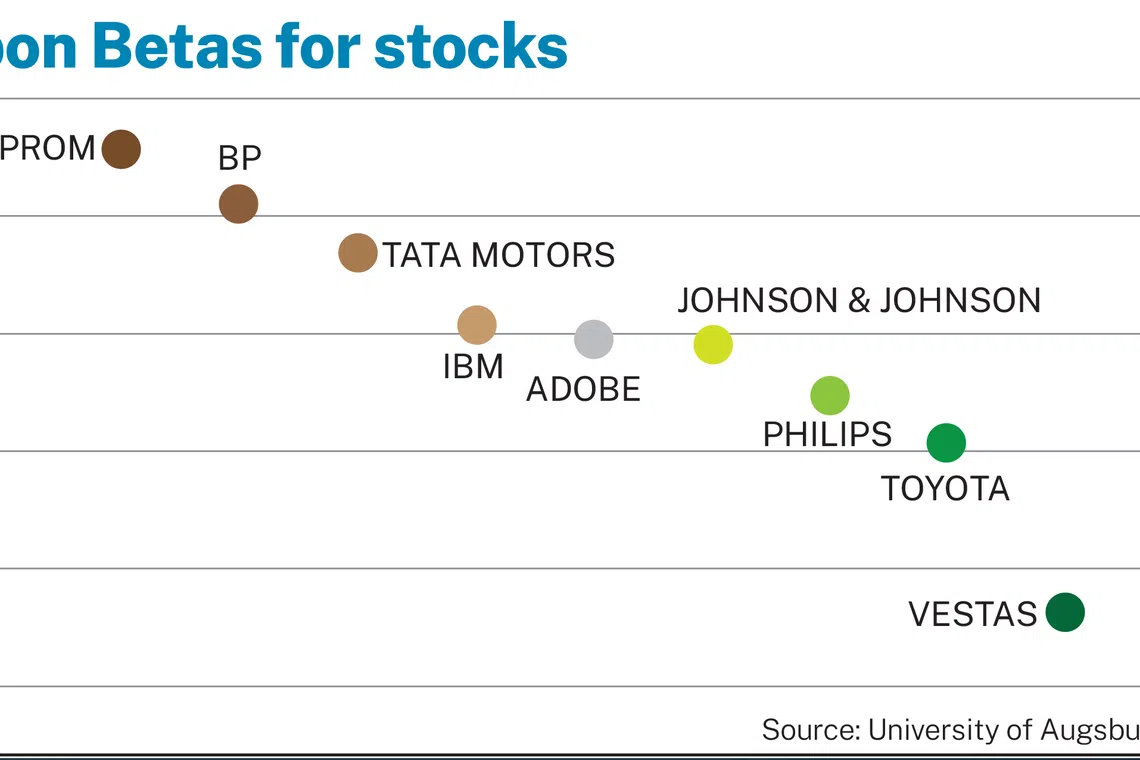
Step 4: Incorporate the “Brown Minus Green” figure in the Carhart 4-factor model, a popular multifactor model used to price securities, to find “Carbon Beta” – a value reflecting the capital market’s perception of the carbon risk of respective assets or portfolios.
Findings: The US GI World Precious Minerals Fund was found to have a “high carbon risk” with a Carbon Beta of 2.59. This suggests the fund would be adversely affected in a transition event.
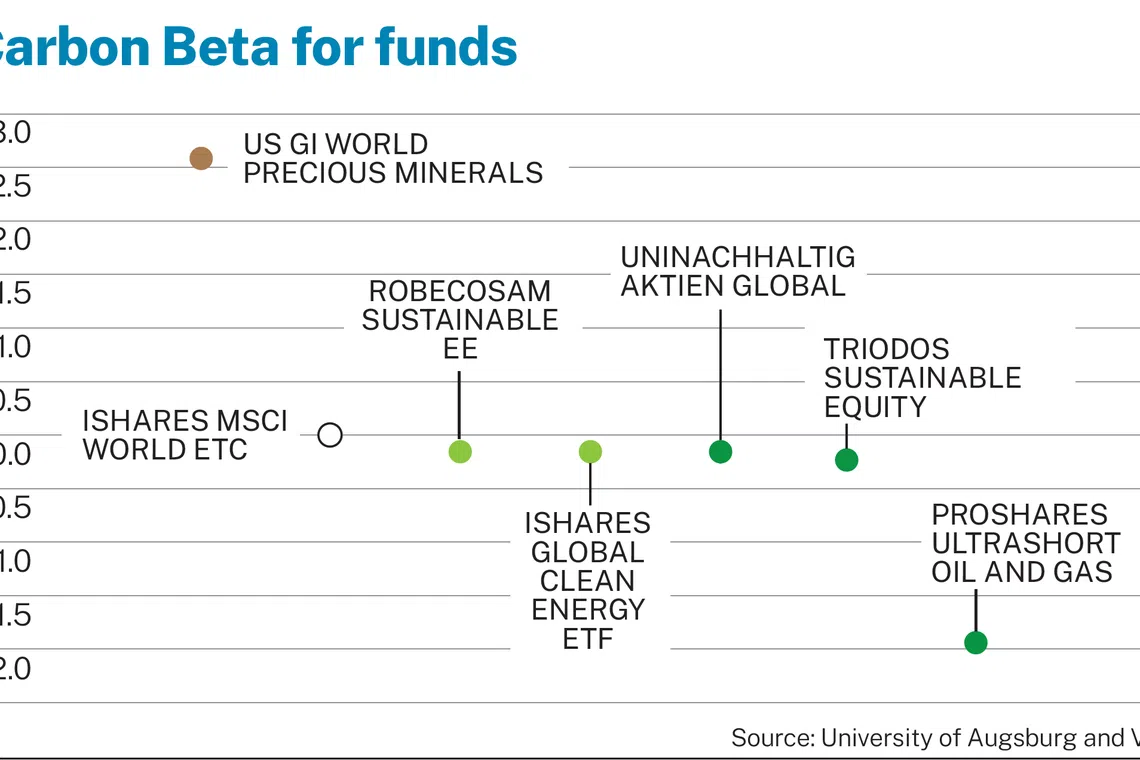
In contrast, ProShares UltraShort Oil & Gas, which has a negative Carbon Beta, can benefit much from a low-carbon transition. Funds with near zero Carbon Betas are interpreted as being insensitive to carbon risk.
3) Acute risk analysis
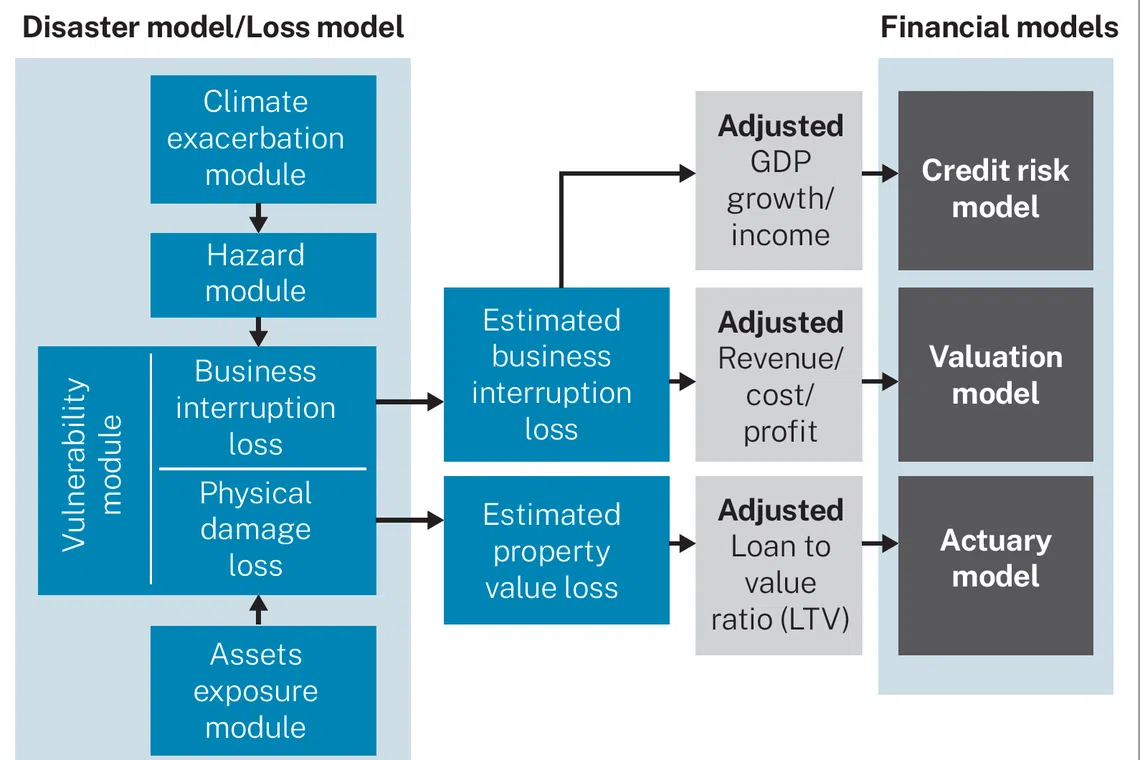
This method can quantify the risks of specific natural disasters on assets, and has been used to gauge the impact of future typhoons on property prices.
It comprises 4 “modules”, including one on climate exacerbation that could link temperature gains from carbon concentration with incremental changes in the intensity and probability of a hazard.
Case study: Coastal cities of China
Step 1: Select cities. The study picked 40 coastal cities in 8 provinces where typhoons had accounted for 85 per cent of their economic losses between 2004 and 2016.
Step 2: Estimate outstanding mortgage loans. Limited by data availability, the study scaled 2018 national mortgage loan data to the district municipality level.
Step 3: Identify locations of the properties by geocoding the centre of the municipal districts.
Step 4: Generate profiles under climate scenarios. This can be done by combining historical data of tropic cyclones available on the International Best Track Archive for Climate Stewardship with studies on exacerbation effects.
Step 5: Develop vulnerability curves, denoted by the relationship between loss of property value and wind speed.
Step 6: Estimate how annual value loss of the properties could be impacted by GDP loss – seen as a proxy for decline in household income – compared to a baseline scenario.
Step 7: Approximate changes in the probability of default, loss given default, and expected loss of mortgage loans based on existing financial models.
Findings: The probability of default and expected loss of mortgage in China’s coastal cities may multiply 2.5 times by 2050, under a “business as usual” high-emissions global warming scenario.
Case study: Agriculture
The UN Environment Programme Finance Initiative used this method to study the agriculture sector. Losses of crops and livestock were assessed in cases of extreme climate events like storms, flooding, extreme heat and drought.
Income statement metrics were then adjusted, by translating production losses into the revenues and cost of goods sold, to determine changes to the probability of default.
Findings: In the worst case scenario where the globe warms by 4 degree Celsius in the 2040s, an agriculture company could lose more than 20 per cent of its annual revenue from climate change.
The credit rating of the bank’s agriculture portfolio could drop a notch as a result. The mixed farming and cotton industries are the most vulnerable to physical risks within the sector, with a 2-notch downgrade expected.
4) Chronic risk analysis
One study highlighted that global physical labour productivity could drop by up to 18.3 per cent if the world is 3 degrees Celsius hotter. Climate change is also found to cause some rivers in Europe to lose transportation capacities due to low water levels.
This method takes into account such permanent changes in living conditions affecting health, labour productivity, agriculture and ecosystems, incorporating systemic impacts to estimations of reduced production, income, crop yields and macroeconomic output.
Climate change advisory firm Acclimatise and consultancy firm Vivid Economics had incorporated it in an analytical toolkit which they developed to map physical risks across sectors and supply chains. Here is an overview of their framework.
Step 1: Sectors are scored based on 4 vulnerability indicators: Their degree of reliance on climate-sensitive supplies, demand, transport routes, and natural resources. These are meant to fully cover their entire value chain.
Step 2: Hazard data are layered onto vulnerability indicators to retrieve location-specific risk scores. This helps link, for instance, transport routes, to climate events, be they floods, wildfires, sea level rises or storm surges.
Step 3: Core exposure data is incorporated into the risk assessment by considering other investment sectors, sub-sectors, or associated geographies involved.
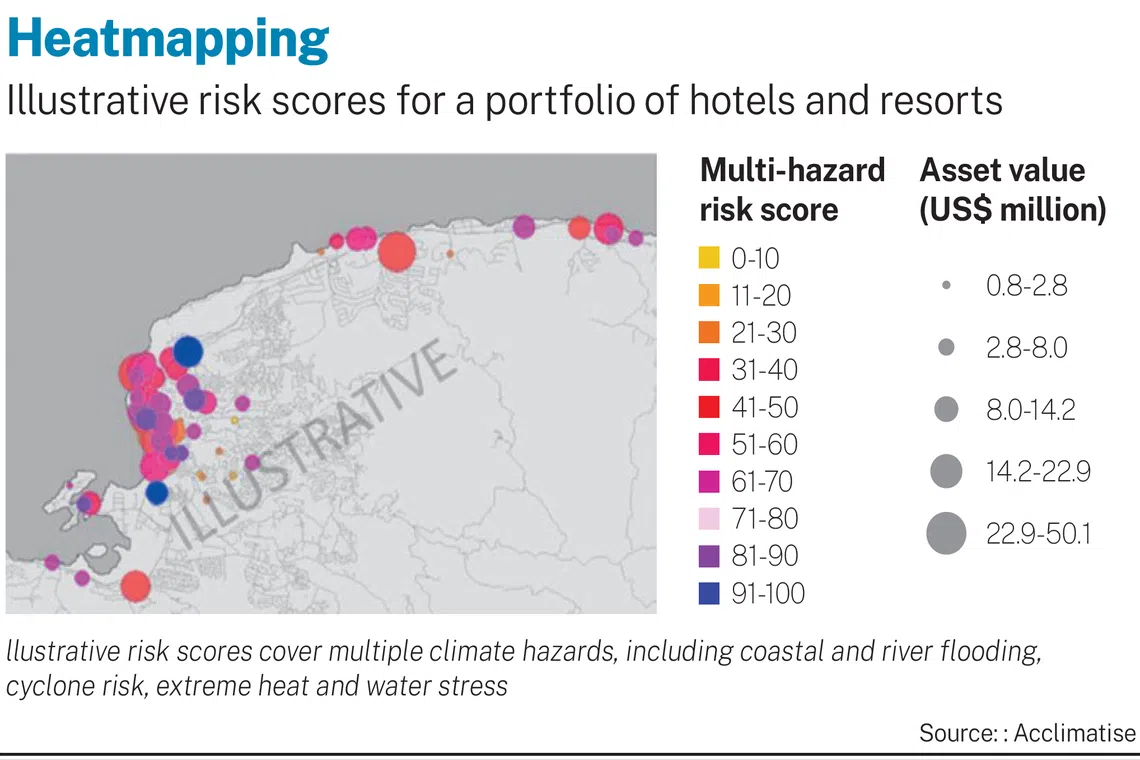
Step 4: Results may be presented as a multi-hazard risk score overlaid with asset value, drawing visual attention to vulnerable assets.
Step 5: Those interested in quantifying the effects at the economy, sector level or company-specific value chain may conduct a deeper analysis by deploying computational general equilibrium (CGE) models to assess the interaction among sectors or regions.
CGE models are simulation tools frequently used to answer policy questions. Acclimatise and Vivid Economics said the model they used provides an understanding of how climate change shocks feed through the entire economic system, sector by sector.
In estimating the risks’ impact on company-specific value chains, changes in facility-level production, physical asset damages, business interruption and supply chain disruption may be considered, and used as inputs for financial asset modelling.
Findings: Metals and mining industries rely heavily on the availability of natural resources and labour productivity, which could be heavily affected by increasing temperatures and more frequent heatwaves.
Power and energy sectors’ vulnerabilities vary by sub-sectors, though a common vulnerability is the dependence on water. Thermal plants, for instance, rely more heavily on water resources to cool operations.
TRENDING NOW
Indonesia begins cutting natural gas exports to Singapore from Oct 24: reports

Singapore’s central gas buyer affirms Indonesia’s role as ‘important partner’ amid export review warning

KKR founders among investors buying 42% of Peter Lim’s Valencia; club valued at US$1.4 billion

NEA issues notices to 10 Singapore-based companies, including Wilmar and APP, over haze

