GBP/USD at an inflection point after a strong first half of 2025

[SINGAPORE] The British pound (GBP) has enjoyed a robust first half of 2025 against the US dollar (USD), driven largely by sustained dollar weakness. The GBP/USD pair bottomed out at 1.21 on Jan 13 before staging an impressive rally to a peak of 1.37 on Jul 1.
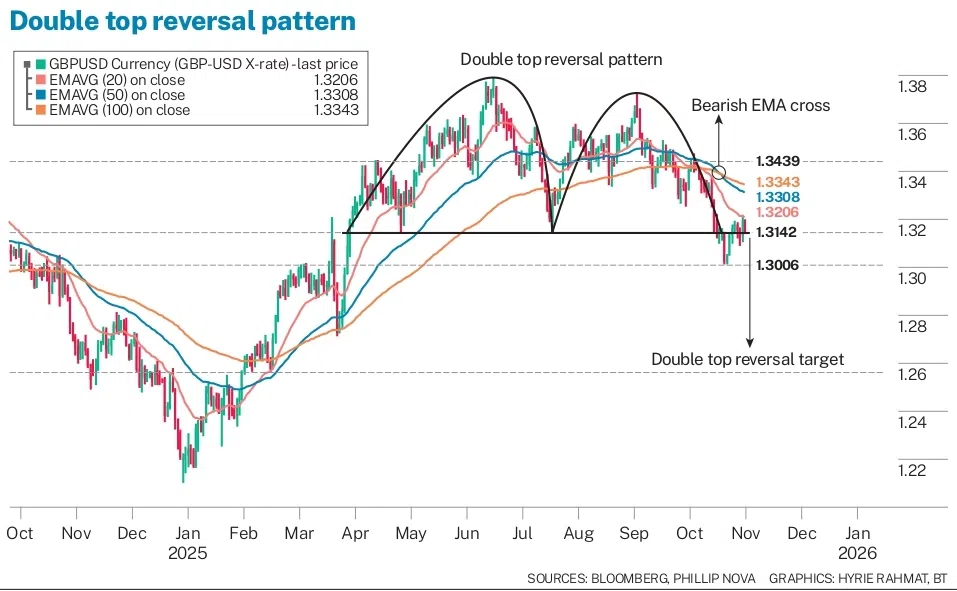
However, the momentum faded in the third quarter as the pair retraced and moved sideways through mid-September, before turning lower once again in November. Currently, the technical setup for GBP/USD shows a bearish bias, supported by several indicators pointing to potential downside risks.
At the start of November, a bearish crossover occurred between the 50-day and 100-day exponential moving averages (EMAs). In technical analysis, a bearish cross happens when a shorter-term moving average crosses below a longer-term one, signalling that momentum is shifting to the downside. Because EMAs place greater weight on more recent prices, such a crossover often indicates rising selling pressure and the potential start of a downtrend.
On the daily chart, GBP/USD has also formed a large double top, another classic reversal pattern that often marks the transition from an uptrend to a downtrend. The pattern resembles the letter “M”, where the price tests a resistance level twice but fails to break higher on both occasions.
The midpoint between the two peaks forms a “neckline”, which acts as a key support. A confirmed break below this neckline signals that buying momentum has likely been exhausted and that a new downtrend could be forming. In this case, the neckline was established around 1.314, which the GBP/USD broke below on 3 November before testing the next psychological support zone at 1.300 and rebounding sharply.
As at Nov 13, prices have recovered back above the neckline and are approaching the 20-day EMA, which now serves as a near-term resistance level. This recent price action reflects a crucial inflection point. How the price behaves around the 1.314 neckline in the coming week could set the tone for the remainder of the year.

A rejection from this level would confirm the earlier breakdown from the double top, reinforcing the bearish outlook. If this scenario plays out, the next potential downside target lies near the 1.2560 level. This projection is based on the measured move rule, where the distance between the neckline and the double top’s peak is used to project downwards from the neckline to estimate the likely extent of the decline.
However, if GBP/USD sustains a move back above 1.314 with strong momentum, the bearish pattern would be invalidated, and the pair may continue to consolidate or even attempt a broader recovery.
The writer, CMT, is senior strategist at Phillip Nova
Decoding Asia newsletter: your guide to navigating Asia in a new global order. Sign up here to get Decoding Asia newsletter. Delivered to your inbox. Free.
Share with us your feedback on BT's products and services


