

Gold likely to pull back after recent rally
The US$4,400 to US$4,500 per ounce area could act as near-term resistance and limit further upside
 Add BT as a preferred source
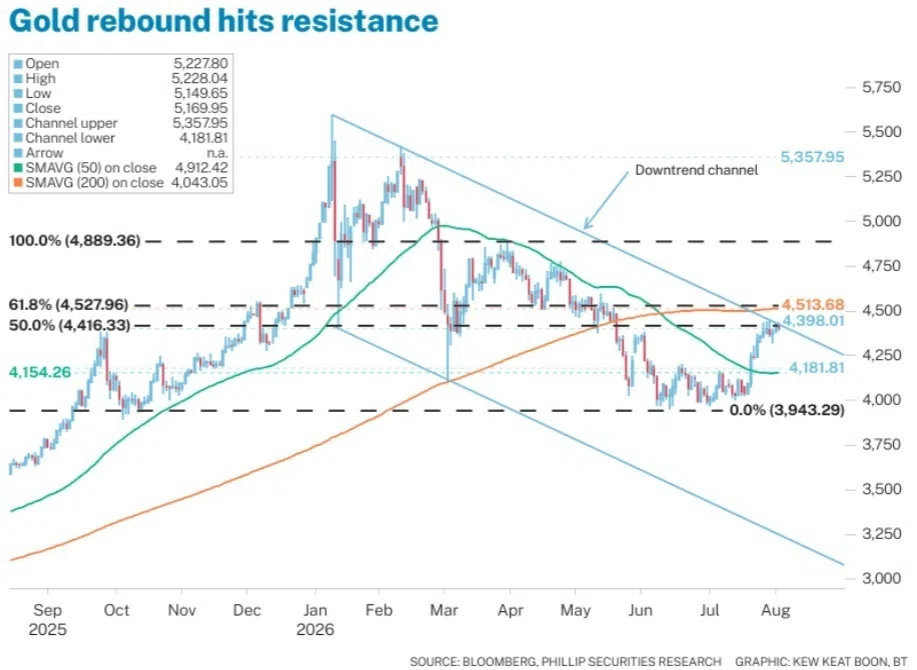
GOLD rebounded in July and August this year, rising to around US$4,400 per ounce at the time of writing. This represents a 12 per cent swing from the year to date low of US$3,943 per ounce formed on Jun 30. The recent rebound for gold could be attributed to several factors.
One of the primary drivers behind gold’s recent rebound is a pullback in Federal Reserve rate hike expectations. Earlier in the year, concerns over persistent inflation and elevated oil prices fuelled expectations that the Fed might pursue further monetary tightening. In addition, the tone and structural reforms communicated by new Fed chairman Kevin Warsh added to expectations of a prolonged period of elevated interest rate, with Warsh stressing the need to uphold the Fed’s price stability mandate. However, the latest non-farm payrolls released in August showed that the US economy lost 23,000 jobs, a surprise reading compared to the forecast of an 85,000 increase. Employment figures for May and June were also revised down by a combined 103,000. Moreover, the July CPI came in at 3.4 per cent, in line with expectations. With the release of softer US economic data, markets quickly pared back expectations for a September rate increase, boosting gold’s appeal as a non-yielding asset.
Additionally, the return of Western investment demand helped prop up gold prices. The World Gold Council reported that global physically-backed gold exchange-traded funds (ETFs) attracted US$3 billion of net inflows during July, ending two consecutive months of outflows. Total holdings rose by 23 tonnes to 4,068 tonnes, with European funds’ repositioning driving most of the buying.
The US-Japan intervention episode at the end of July also put downward pressure on the US dollar index, with a weaker dollar making bullion cheaper for holders of other currencies, driving up international demand and lifting spot prices.
From a technical perspective, gold is likely to pull back after the recent rebound brought prices towards a resistance area. Gold has retested the resistance area of a downtrend channel that has formed since the end of January. The US$4,400-US$4,500 per ounce area also coincides with the 200-day simple moving average (SMA), which gold broke down in early June. This area is also confluent with the 50 per cent to 61.8 per cent Fibonacci retracement levels, calculated using the swing high of US$4,889 an ounce formed on Apr 17 and the swing low of US$3,943 an ounce formed on Jun 30.
To conclude, the recent rebound in gold prices came after a pullback in Fed rate hike expectations, resurgent demand in physically-backed gold ETFs and a weaker dollar. However, the US$4,400 to US$4,500 per ounce area could act as near-term resistance and limit further upside. Should the price retest close to the US$4,154 per ounce level where the 50 SMA is, it would likely hold as a strong support, confluent with the breakout of a previous horizontal resistance level.

The writer is a senior research analyst at Phillip Securities Research
Decoding Asia newsletter: your guide to navigating Asia in a new global order. Sign up here to get Decoding Asia newsletter. Delivered to your inbox. Free.
Share with us your feedback on BT's products and services
TRENDING NOW

National Day Rally: 8 things to know, from more childcare leave to higher BTO income ceiling

How BYD disrupted Singapore’s car market – and why the strategy is turning on itself

NDR 2026: Every Singaporean child to get direct financial support from birth to age 17

When every phone becomes a satellite phone, what happens to Asia’s telcos?

