

Hang Seng Index attempts recovery after prolonged downtrend
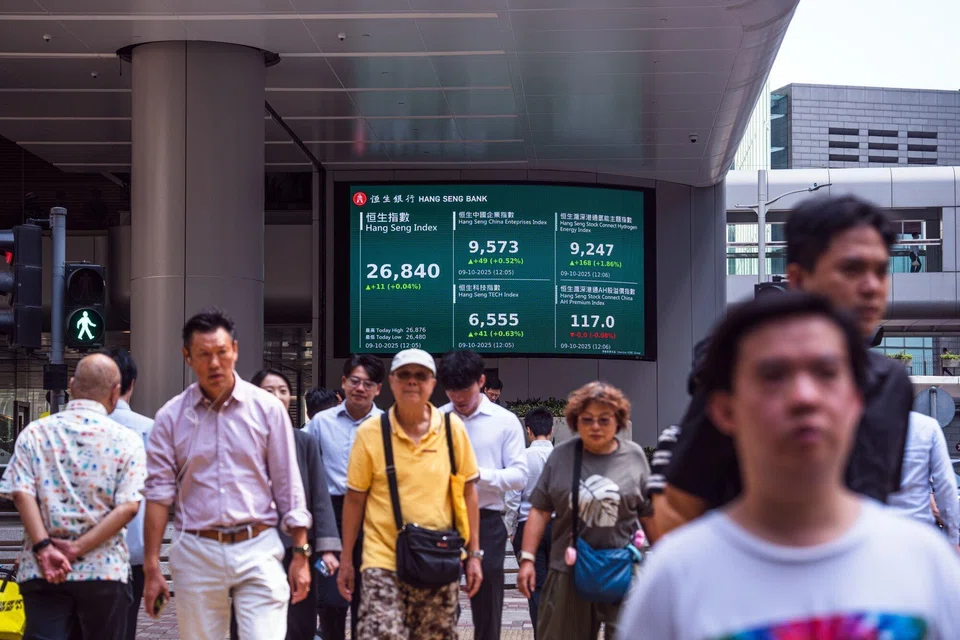
THE Hang Seng Index (HSI) entered the second half of 2026 showing early signs of stabilisation after an extended period of underperformance. While major US equity indices continued to reach record highs through 2025 and 2026, the HSI largely traded sideways during the second half of last year before peaking near the 28,000 level in late January 2026. Since then, the index has experienced a sustained downtrend, reflecting weaker investor sentiment towards Hong Kong and mainland Chinese equities amid slowing economic momentum and cautious corporate earnings expectations.
The first quarter of 2026 was particularly challenging. After approaching the 28,000 level, the HSI fell sharply to around 24,100, erasing much of the previous year’s gains. Although improved global risk sentiment at the start of the second quarter supported a modest rebound, the recovery was short-lived. Selling pressure intensified from May through late June, driving the index lower again.
From a technical perspective, the HSI continues to exhibit a weaker structure compared with other major global indices. Since May 2026, the index has remained below its major Simple Moving Average (SMA) levels, reflecting persistent downside momentum. Technical weakness first emerged in April when the 50-day SMA crossed below the 100-day SMA, signalling a deterioration in the intermediate-term trend. This bearish outlook strengthened further in June after the 100-day SMA crossed below the 200-day SMA, confirming a longer-term bearish alignment. The successive bearish moving average crossovers indicate that sellers have maintained control throughout much of the first half of the year.
More recently, however, technical conditions have shown signs of improvement. The July rebound has lifted the HSI back above the 23.6 per cent Fibonacci retracement level near 23,825, and established this area as the first important support zone. As long as the index remains above this region, the recent recovery could continue to develop. Below this, the June low at around 22,518 represents the next major support level.
On the upside, the 38.2 per cent Fibonacci retracement level near 24,633 represents the first significant hurdle for the ongoing rebound. A decisive break above this level would indicate improving market sentiment and increase the probability of a broader recovery. Such a move would also allow the index to begin testing its declining moving averages, which have acted as dynamic resistance throughout recent months.
Beyond the Fibonacci resistance, a more critical technical barrier lies between 25,150 and 25,300. This region previously served as an important support zone before the May sell-off and has since transitioned into a significant resistance area. A successful breakout above this zone would represent a meaningful shift in market structure, suggesting that the longer-term downtrend is beginning to reverse.
Nevertheless, the bearish alignment of the major moving averages indicates that the recovery remains in its early stages, and sustained buying interest will be required before the broader trend can turn positive.
In summary, the HSI is attempting to recover after a difficult first half of 2026. Initial support is seen at 23,825, followed by the June low near 22,518 should selling pressure return. On the upside, a break above 24,633 would strengthen the recovery outlook and pave the way for a test of the important 25,150 to 25,300 resistance zone. Until these resistance levels are overcome, the HSI is likely to remain in a broader recovery phase within a longer-term corrective trend.
The writer is manager of dealing and investor education at Phillip Securities
Decoding Asia newsletter: your guide to navigating Asia in a new global order. Sign up here to get Decoding Asia newsletter. Delivered to your inbox. Free.
Share with us your feedback on BT's products and services
TRENDING NOW
DBS, OCBC, UOB rout lops billions off STI as inflation, rate concerns spook investors

Grab CEO’s wife Chloe Tong on life with Anthony Tan and finding her purpose

OCBC sheds S$8 billion in value as shares close nearly 6% down; analysts cautious on banks
Deal between tycoon friends sparks scrutiny of Philippine power sector

