

Has gold’s bear market run its course?
As long as the US$3,960 support zone holds, the bullish bias remains intact
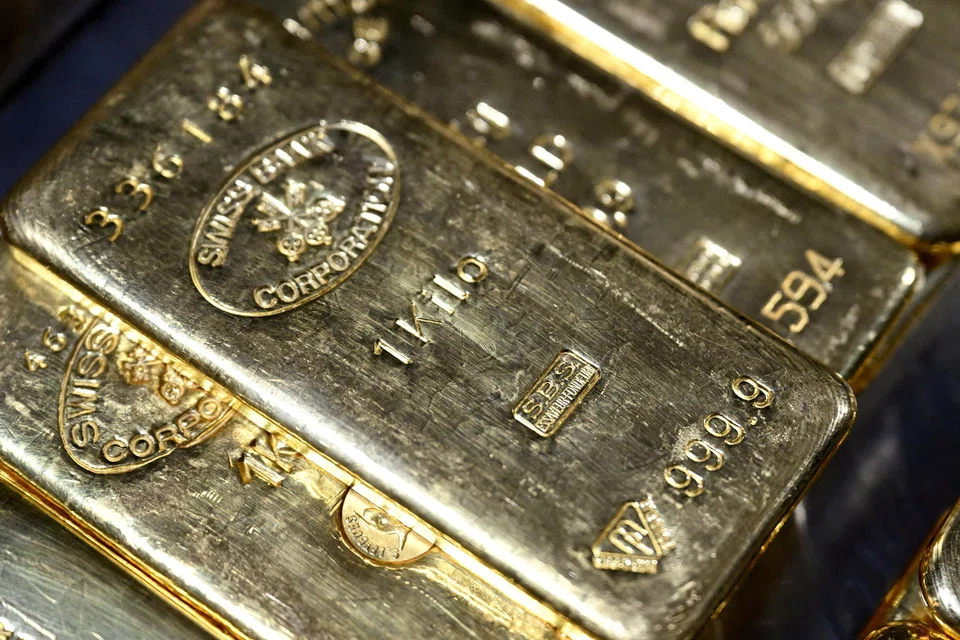
GOLD has come a long way since notching an all-time high of near US$5,600 per ounce on Jan 29. As at Jul 30, the metal has shed roughly 28 per cent of its value from that peak, trading around US$4,040 per ounce and finding a floor at the closely watched US$4,000 psychological support level.
Through July, gold has settled into a consolidation range between US$3,959 and US$4,200, anchored by that US$4,000 support. On the surface, the technical picture still looks bearish, with price remaining below the 20, 50, and 200-day exponential moving average (EMA). But a closer look at the charts suggests the selling pressure may be running out of road, with two signals pointing to a possible trend reversal.
The first is a trendline breakout. Since March, gold has traced a series of lower highs that connect into a clear downtrend line. On Jul 22, price broke decisively above this resistance, which has since flipped into a dynamic support, a classic early signal of a shift in trend.
The second is momentum divergence. The relative strength index (RSI) is best known for flagging overbought and oversold conditions at the 70 and 30 marks, but its more powerful use lies in spotting divergences. Since June, gold has shown a bullish divergence: even as price carved out lower lows and lower highs, the RSI has been printing higher lows and higher highs, a sign that selling momentum was fading even as prices continued to fall.
Looking ahead, US$4,200 stands as the immediate resistance, with US$4,400 as the next target beyond that. Traders should also keep an eye on the key daily EMAs (20, 50, 100 and 200), which tend to act as dynamic resistance levels during an uptrend. A crossover of the 20-day EMA above the 50-day EMA would add further conviction to the bullish case.
As long as the US$3,960 support zone holds, the bullish bias remains intact. Should gold break decisively below this level, however, the next major support could come in as low as US$3,450, a historical resistance zone that gold broke out of strongly in August 2025 and has not revisited since.


The writer is senior strategist at Phillip Nova
Decoding Asia newsletter: your guide to navigating Asia in a new global order. Sign up here to get Decoding Asia newsletter. Delivered to your inbox. Free.
Share with us your feedback on BT's products and services
TRENDING NOW

DBS, OCBC, UOB rout lops billions off STI as inflation, rate concerns spook investors

Grab CEO’s wife Chloe Tong on life with Anthony Tan and finding her purpose

OCBC sheds S$8 billion in value as shares close nearly 6% down; analysts cautious on banks

Deal between tycoon friends sparks scrutiny of Philippine power sector

