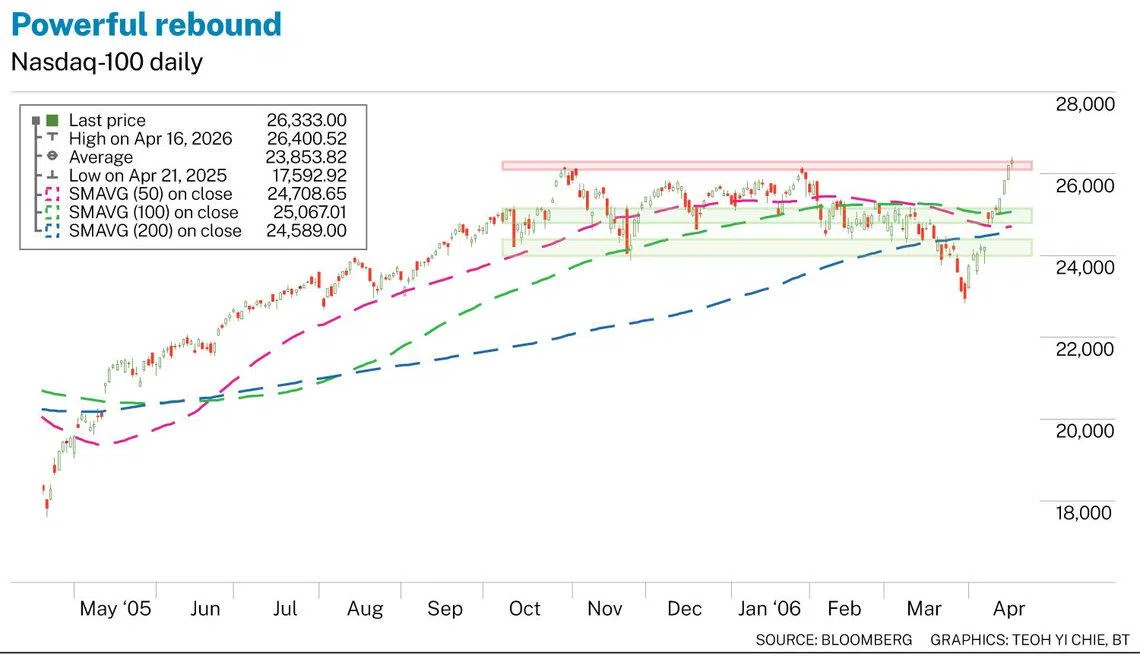
Nasdaq-100 tests key resistance after sharp recovery
It is now testing the upper boundary of the prior double-top zone near 26,300

THE Nasdaq-100 Index has staged a remarkable recovery in recent weeks, surging from its March 2026 lows near 22,800 to approximately 26,300 at the time of writing. This represents a near 15 per cent rebound over a remarkably short timeframe.
This sharp V-shaped recovery has caught many market participants off guard, fuelled by renewed investor optimism as geopolitical concerns in the Middle East ease and attention shifts towards potential diplomatic resolutions.
The rally has been led by strong performances in semiconductor, software and other major artificial intelligence-related stocks, further accelerated by short-covering activity as prices broke above successive resistance levels.
The speed and magnitude of this rebound closely resemble the recovery witnessed between April and July 2025, when the index climbed from its April lows near 16,600 to eventually reach all-time highs near 26,200 by late October 2025.
While history may not always repeat itself, the structural similarities suggest that buying momentum remains robust, with investors demonstrating a willingness to accumulate positions on dips.
However, the index is now approaching a formidable resistance zone that has historically acted as a significant ceiling for the Nasdaq-100.
A double-top formation between 26,180 and 26,300, first established in late October 2025 and reaffirmed in January 2026, remains the most critical technical hurdle for bulls.
A decisive and sustained break above this zone would carry strong technical significance, potentially paving the way for a re-test of all-time highs.
Conversely, failure to clear this level would reinforce the double-top pattern and maintain it as a medium-term resistance ceiling.

Technical structure and key levels
From a technical perspective, the Nasdaq-100’s recovery has restored several key structural elements that had deteriorated during the February-to-March 2026 decline.
Notably, the index has reclaimed its 100-day simple moving average (SMA), which previously served as a consistent support base throughout much of 2025 before being breached in February 2026. The recapture of this moving average is a positive development and signals improving medium-term momentum.
The 50-day SMA has also turned higher, following the sharp rebound, suggesting that short-term trend conditions are improving.
Meanwhile, the 200-day SMA, which had previously served as a key battleground near the 24,350 area during the March decline, now sits below current price levels and may transition into a support level if the index experiences any near-term pullback.
On the upside, the immediate resistance zone between 26,100 and 26,300 had been the critical level to watch. The Nasdaq-100 has now convincingly broken and closed above this barrier, holding firmly above the all-time high at 26,300. This decisive move has invalidated the previous double-top formation and opens the path toward further gains, with the next logical targets situated between 26,800 and 27,500.
On the downside, should the index fail to hold above the former double-top resistance zone, the initial support area lies between 24,800 and 25,150, corresponding to the earlier consolidation zone. A deeper correction could see the index retest the 24,000–24,400 region, where the 200-day simple moving average converges with prior price support.
A decisive break below this level would raise questions about the sustainability of the current recovery and shift the technical outlook to a more cautious stance.
In summary, the Nasdaq-100 has executed a powerful rebound from its March 2026 lows and is now testing the upper boundary of the prior double-top zone near 26,300.
Bulls need a decisive close above 26,300 to confirm a breakout and support further upside towards new highs, while a rejection could trigger a consolidation or pullback towards the 24,000 to 25,150 support band.
The price action at this area will be critical in setting the directional tone for the index in the second quarter of 2026.
The writer is dealing manager at PhillipCapital
Decoding Asia newsletter: your guide to navigating Asia in a new global order. Sign up here to get Decoding Asia newsletter. Delivered to your inbox. Free.
Share with us your feedback on BT's products and services
TRENDING NOW

What makes a good job? Feeling that you matter

Lermit Road bungalow owned by family of Dennis Lee’s son on the market at S$98.8 million

A ‘shadow bank’ hiding in Singapore’s Little India casts light on financial services gap

Keppel DC Reit prepares Singapore data centre for potential redevelopment; H1 DPU up 11.3%