Nasdaq facing downward pressure in near term

THE Nasdaq-100 Index delivered an impressive 25.9 per cent gain in 2024, led by the stellar performance of heavyweight technology counters such as Nvidia and Alphabet.
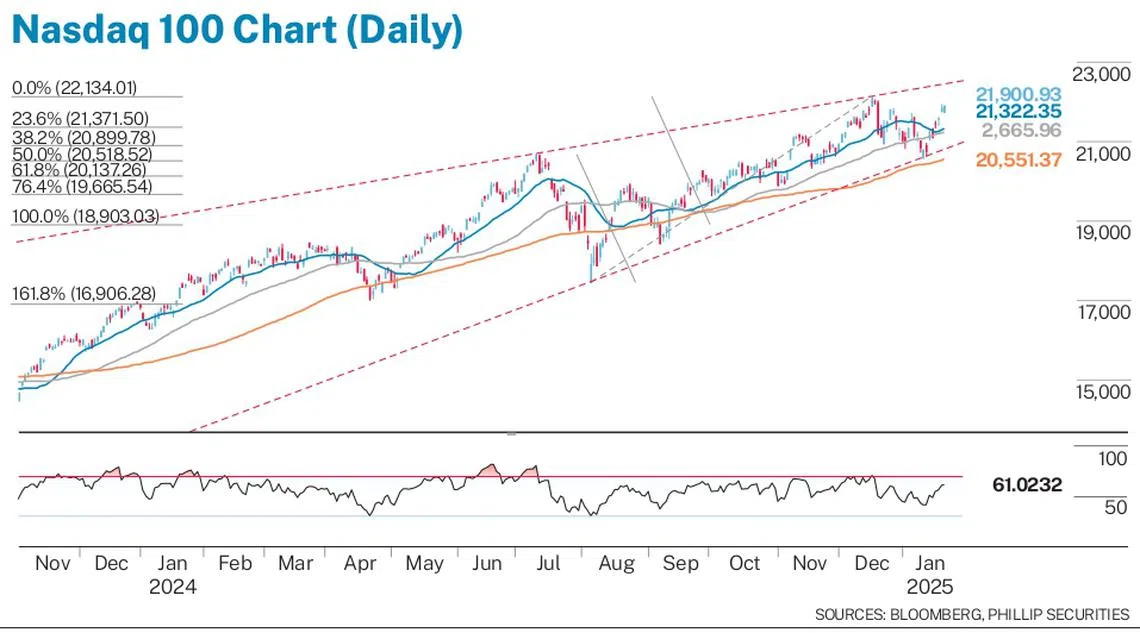
After a correction between July and August 2024, the index has been on constant uptrend reaching new highs in the final quarter of 2024 and breaking above the 22,100 level in December.
However, volatility has picked up since mid-December 2024, fuelled by fluctuating interest rate expectations and Trump’s inauguration. The US Federal Reserve cut interests rates by a total of 100 basis points in 2024 and has forecasted further cuts of 25-50 basis points in 2025.
Meanwhile, Trump’s second term as US president has also moved capital markets, following his new executive orders and mentions of policies.
Bullish scenario
The Nasdaq-100 has rebounded off the uptrend line supported by the 100-day simple moving average (SMA) level of 20,425 which coincides with the 0.5 Fibonacci retracement level of 20,518.
After Trump’s inauguration, the index staged a rally, rising above both the 20-day and 50-day SMA level, a signal of renewed bullish momentum. Should the index break above the high of 22,100 recorded in December 2024, the index could enter uncharted territories, potentially reaching the next psychological resistance levels at 22,500 and 23,000.
Bearish scenario
Despite the recent rally, current technical trends have indicated weakening momentum and a possible retracement in the short term.
If the index rejects off the previous high in December 2024, the index might correct back to the first support zone of around 21,371, aligning with the 0.236 Fibonacci level and the 20-day and 50-day SMA levels.
A breach of this initial support could open the door to further declines, with the next levels of interest at the 0.382 Fibonacci retracement level of 20,900, followed by the 0.5 Fibonacci retracement level at the 20,518 area.

In the short term, a retracement is likely to happen based on the uncertainty with Trump’s policies and the seasonal slowdown in trading activity during the upcoming Chinese New Year holidays which might lead to reduced liquidity and heightened volatility.
The writer is manager (dealing and education), Phillip Securities
Decoding Asia newsletter: your guide to navigating Asia in a new global order. Sign up here to get Decoding Asia newsletter. Delivered to your inbox. Free.
Share with us your feedback on BT's products and services


