

Bullish signals from equities and gold raise confusion
Strong performance of S&P 500 contradicts the bullish trend for gold

THE market comprises countervailing forces. Most commonly it reflects a struggle between bulls and bears, optimists versus pessimists. One outlook typically dominates for extended periods, and confusion ensues at the point of change from one trend to another.
This year seems to lack clarity, with equally strong calls from bulls and bears. The chances of a US recession have dwindled, according to some. But others believe the US economy is overheating and more interest rate rises are needed. These calls are amplified by social media, and then amplified again as they are repeated in the echo chamber of mainstream media.
Investors, dragged from one extreme view to another, end up in a state of confusion. The danger is that investors may become wedded to one particular view, and they interpret all new information in light of that view. The bulls will see every pullback as an opportunity to get into a rising trend cheaply. The bears see every rally as the end of the uptrend and an opportunity to go short.
An effective market relies on these divergent views to make for efficient price discovery and accurate valuation of traded stocks, but short-term variations of these views distort market activity. It is difficult for investors to determine what is really happening.
In this situation, we prefer to close our ears to the noise and focus on the information provided from the charts of index activity, and use these to support or dismiss our prior view of the market.
The S&P 500 index is a more accurate guide to the US market than the Dow. The current strong rally started from 3,500. This was the downside target calculated from the head-and-shoulder trend-reversal pattern that developed between October 2021 and March 2022. The downtrend breakout was confirmed in April 2023 with the rebound from the downtrend line.
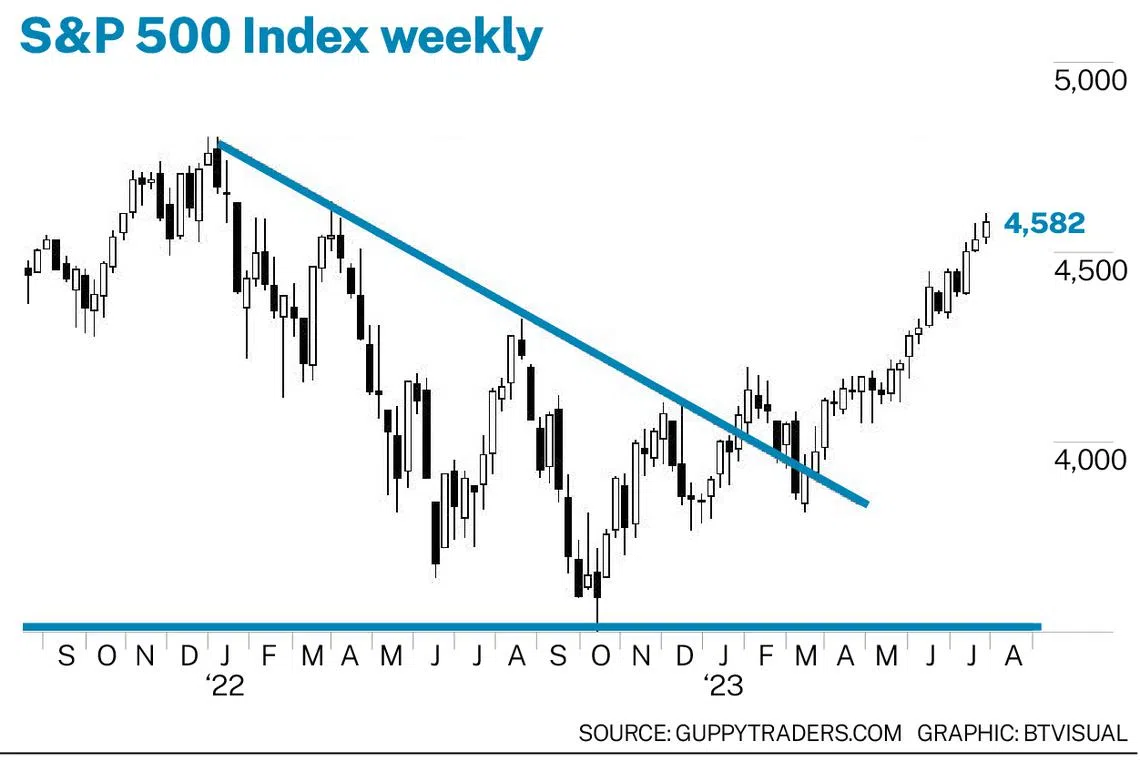
The uptrend has been clear, stable and consistent. This supports the bullish interpretation of the market.
Some analysts suggest this reflects Fomo (fear of missing out), but the trend stability suggests this is not the case. There are no indications of end-of-trend behaviour, but investors will watch how the index develops as it approaches the previous peak near 4,820.
This is not a formal resistance level, but there is a good probability of some consolidation around this level simply because it is a psychological point. Investors will watch carefully for any indication of the development of end-of-trend patterns in this consolidation.
The strong S&P performance seems a contradiction because strong equity markets are usually bearish for defensive assets like gold. The rise in the gold price starting in October 2022 was replicated by the S&P rise that started in November 2022. Gold reflected a flight to safety, and the S&P reflected a return to risk assets.
Following the breakout and retreat, the gold price at US$2,110 remains above the resistance and support levels shown by line B. This is a bullish environment, but the uptrend is constrained by the uptrend line. This trend line now acts as a resistance feature, limiting future rises in the gold price. This does not mean the uptrend in gold has ended, but it does suggest it will not be as powerful and sustained as the previous uptrend.
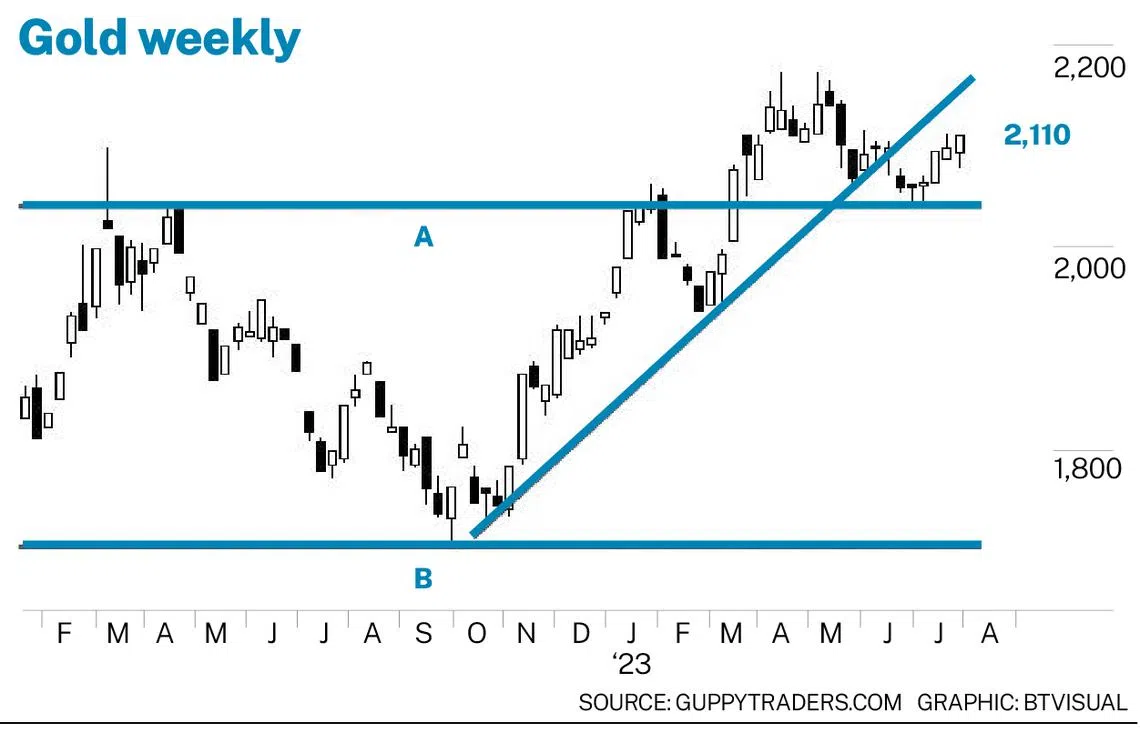
In the longer term, the upside for the gold price is near US$2,500. This is calculated by taking the width of the trading band between support at line A and resistance at line B. This value is projected upwards to provide the long-term target. This calculation provides no guidance to how quickly the target will be achieved, or how bumpy the ride will be.
These apparently contradictory signals from the S&P and gold chart make it difficult for investors to make clear decisions. Investment success comes from trading what we see on the charts, rather than what we believe or hope will happen.
Last month, the risk-sensitive charts of oil and the Taiex suggested markets believed we were entering a period of global stability. They suggested markets were not expecting an outbreak of new conflicts or acceleration of existing conflicts. The S&P chart confirms these conclusions with the sustained uptrends, but the gold uptrend suggests many are hedging their optimism.
The writer is a financial technical analysis specialist, equity and derivatives trader, and author. He has developed several leading technical indicators.
TRENDING NOW

World’s largest offshore wind platform by Seatrium consortium on track to be completed by 2028

Is stamp collecting enjoying an analogue revival or are its best days over?

GovTech retrenches another 38 staff in second round of layoffs

MBS adjusted property Ebitda falls 20.6% in Q3 with fewer high-roller visits, weaker hold

