Five days for the future
The January effect is historically predictive of the market’s direction for a new year, with 83 per cent accuracy. But 17 per cent of the time, the pattern fails

LIKE the cricket Alamac held dear by cricket fanatics, the stock market can be analysed as a collection of statistics. High on the list of well-known statistics is the so-called January effect. The idea is that if the market rises in the first five days of a new year, the market would close higher at the end of the year.
It’s not quite a bullish call, but it suggests that the general trend for the following months will be up. Statistically, this is a remarkably accurate indicator for the American market.
According to Stock Trader’s Almanac, the first five trading days of January predict the market’s direction for the year with an 83 per cent accuracy ratio.
In practical terms, this statistic masks remarkable financial courage, the depths of despair and foolish optimism. Even when the forecast correlation is correct, it masks significant drawdowns.
Based on an entry at the first week of January, investors may suffer substantial losses during the year. Holding onto losses requires very deep pockets. Riding market collapses in the hope that the statistical relationship will deliver requires an unusual level of faith and optimism.
This statistical relationship does not specify how high the rise will be. In some years, the pain of holding on delivers just a minor annual market rise.
Navigate Asia in
a new global order
Get the insights delivered to your inbox.
However, the five-day market rise in the Dow this January has statistical traders all a-twitter and the index chart supports this bullish chatter.
Like the other US indexes, the Dow reached the downside target calculated using the head-and-shoulders trend-reversal pattern. However, the Dow rebounded more quickly and more decisively.
The dominant feature on the current chart is the downtrend line that was broken in November.

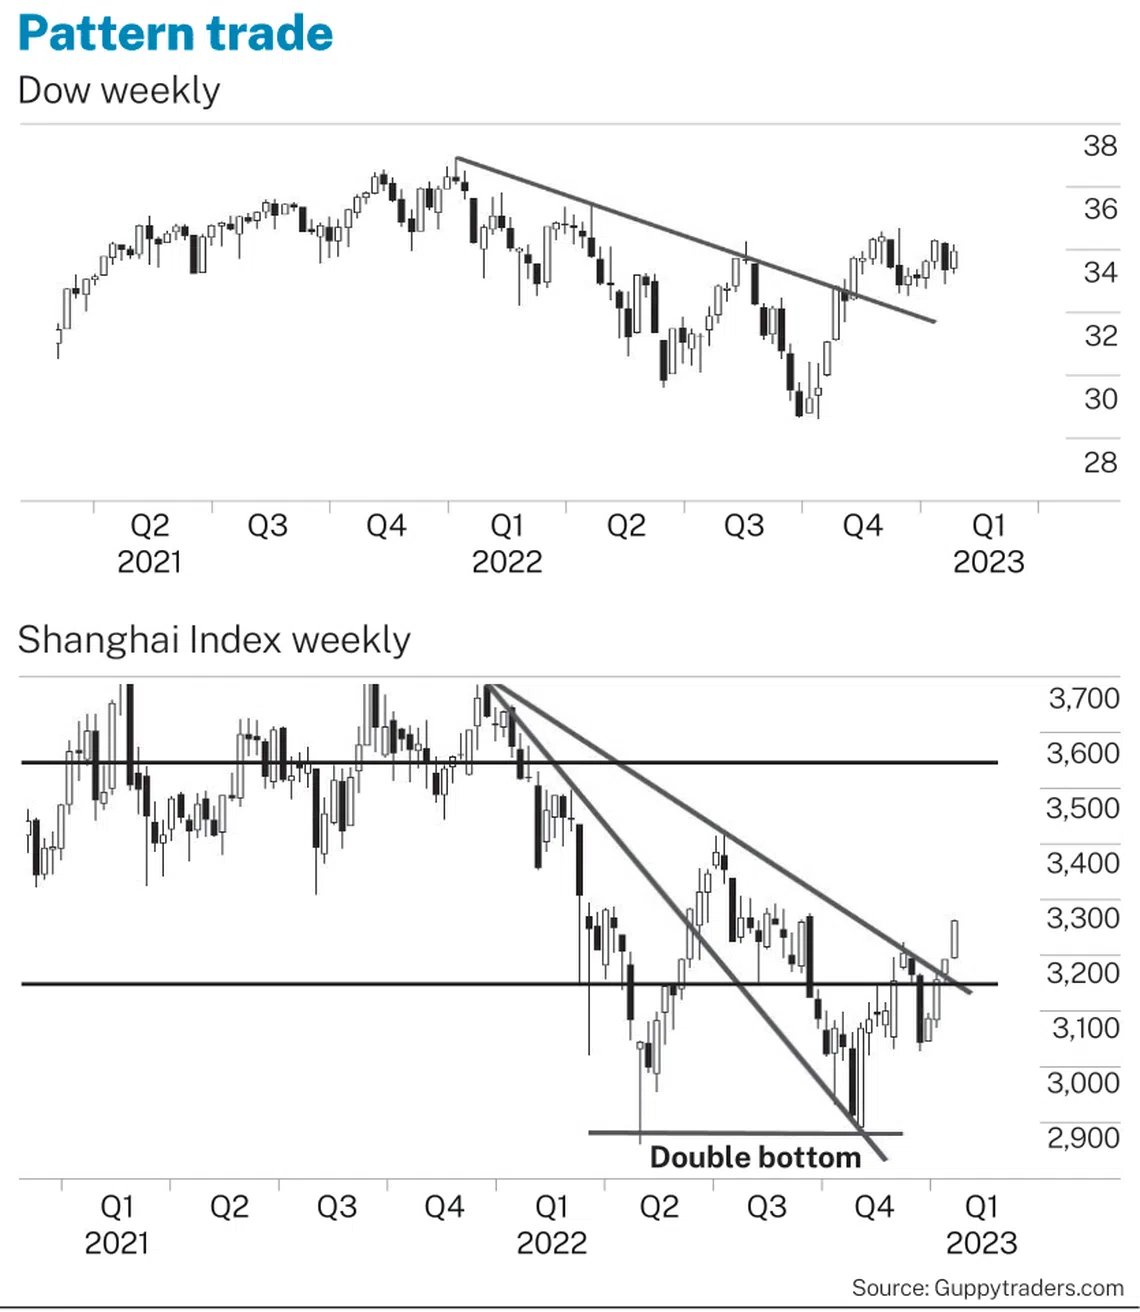
This rally breakout hit minor resistance near 34,000 and was unable to move above this level. It is minor resistance because this level has not acted as a resistance or support level in the past.
Two conclusions are drawn from this activity.
First, this rally and consolidation have not developed into a well-defined uptrend. The bears greet this conclusion with glee. The bulls point to consolidation and the potential for the rally to resume and retest previous highs near 36600.
On balance, the outlook is more bullish, but caution is required until a strong trend direction is established.
The five-day January observation is much less successful when applied to other markets. There is a loose relationship, but it’s statistically insignificant. It is not seen in the China market, either in the Western New Year, or in the five days following the start of the Chinese New Year. Understanding the potential for this market rests on classic chart analysis.
The Shanghai Index has three defining features. The first is the double bottom that developed near 2880. This pattern is often associated with a strong trend reversal.
The second is the fan pattern, which is more fully developed on a daily chart. This is not a Fibonacci fan. The fan pattern is also a strong signal of a trend change, although it cannot be used to set upside targets.
The break above the upper trend line in the fan pattern was a clear confirmation of a trend reversal.
The third feature is the upside target near 3700. This is a strong resistance level, forming a triple-top pattern in 2021.
It is highly likely this will again offer strong resistance to cap the emerging uptrend. The intermediate resistance level is near 3400.
Statistically, the market may follow the January lead in 83 per cent of years, but in 17 per cent of years this statistical relationship fails as it did in 1987, delivering a 38 per cent market collapse.
Investment requires more than just blind adherence to the statistics. Understanding how to apply a stop loss to protect profits and reduce losses is a far more important ingredient of success.
The writer is a financial technical analysis specialist, equity and derivatives trader, and author. He has developed several leading technical indicators used by investors in many markets.
Decoding Asia newsletter: your guide to navigating Asia in a new global order. Sign up here to get Decoding Asia newsletter. Delivered to your inbox. Free.
Copyright SPH Media. All rights reserved.