Market behaviour shows that global risk is diminishing
Market indices indicate that we are entering a period of global stability, but this does not mean markets are immune from domestic challenges caused by inflation and higher rates
IN A recent meeting, US Secretary of State Antony Blinken told China President Xi Jinping that the US does not support Taiwan independence and stood by its stance of maintaining the status quo, affirming decades of US policy towards Taiwan. US President Joe Biden quickly countered this, calling Xi a dictator.
However, it seems Blinken’s conciliatory comments carried more weight, because the Taiwan Index ignored Biden’s provocative insult and continued to rally strongly. Despite all the talk of conflict over Taiwan, the market seems confident that the status quo will remain unchanged, and that mutterings about the future of chipmaker Taiwan Semiconductor Manufacturing Co (TSMC) are misplaced.
Like the Taiwan Index, the TSMC chart also shows a strong rally.
Markets are very sensitive to the slings and arrows of fortune, so they often provide a more reliable picture of future outcomes than the day-to-day media coverage of political outrages, including the failed mutiny in Russia. Markets are rarely caught by surprise, so the behaviour of the Taiwan market is a clear indicator of the level of genuine stress in the US-China-Taiwan relationship.
The Taiwan Index chart suggests the events in 2023 are largely political storms that carry little risk.
The outstanding feature on the chart is the inverted head-and-shoulder pattern. The left shoulder is shown as point A, the head as point B and the inverted right shoulder as point C. Just like its cousin, the inverted head-and-shoulder pattern signals both a trend change and sets a target level for the new trend development.
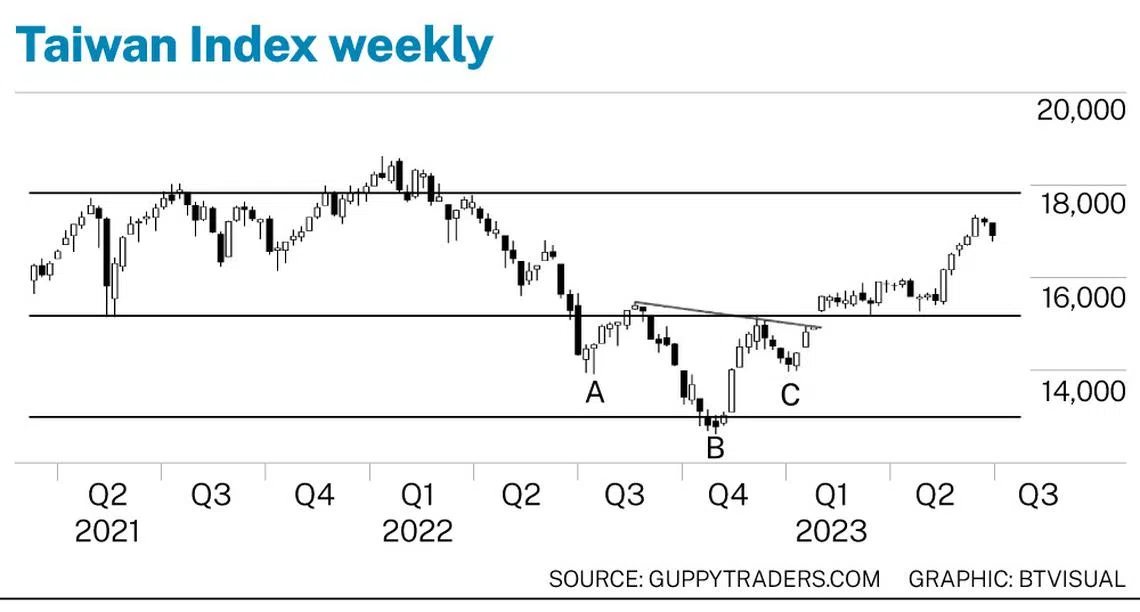
The distance between the sloping neckline connecting the two shoulders and the head is calculated. This value is projected upwards to give an upside target near 17,800.
The Taiwan Index has an additional chart feature. This is the horizontal support and resistance levels near 13,000, then 15,200 and 17,800. Although not exact, these levels have acted as pause points in the index behaviour, so we will look for another pause and consolidation near 17,800.
A successful upside breakout sets the next long-term target between 20,000 and 20,400. A continuation of the breakout above 17,800 suggests a substantial reduction in US-China-Taiwan risk.
When the world worries – when risk is back on – the price of oil rises. This is not exactly correlated, but it is close enough to provide a guide to how markets are viewing the level of economic risk. When global tensions are high, the oil price generally rises.
The Nymex weekly oil chart has reflected a decline in global tensions since the middle of 2022. In this sense, it replicates the pattern of behaviour seen in the Taiwan Index chart.
Since March 2023, oil has traded sideways between support near US$63 and resistance near US$83. This narrow trading band is consistent with the long-term behaviour of the oil market.
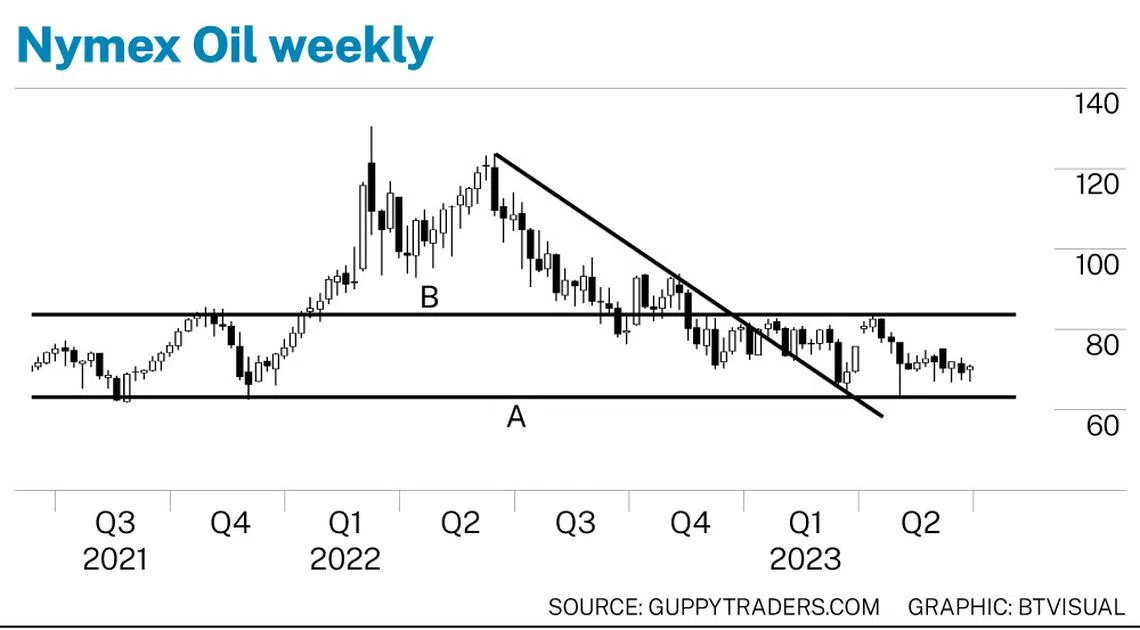
Moves above this resistance level have a target near US$93. Moves below the support level have targets near US$53, which were last seen for a prolonged period in 2019. These trading bands are a consistent and stable structure to this market, enabled in part by the cartel manipulation of supply.
The downtrend that started in mid-2022 has ended, and the chart suggests we are entering a period of sustained sideways movement within a US$10-wide trading band. Just how that translates into petrol prices will depend on the US dollar exchange rate.
The significant conclusion from these risk-sensitive charts is that despite the rhetoric, and the attempted mutiny in Russia, markets believe we are entering a period of global stability. This does not make markets immune from domestic challenges imposed by inflation, rising interest rates and low growth. The chart behaviour suggests that markets are not expecting an outbreak of new conflicts or acceleration of existing conflicts.
The writer is a financial technical analysis specialist, equity and derivatives trader, and author. He has developed several leading technical indicators used by investors in many markets.