Markets undecided with easy solutions
Sometimes the markets reach a decision almost overnight and correct quickly as the fairy dust turns to dross – this may be one of those times

WHEN he was US president, John F Kennedy proposed to put a man on the moon – not because it was easy, but because it was hard.
Now, incoming president Donald Trump is offering to take back the Panama Canal, buy Greenland, end the Ukraine and Israeli wars with a handshake and deport thousands who have made their homes in America – not because it is difficult, but because he thinks it is easy.
It is a type of magical thinking; and the challenge is to decide just how long the financial markets will go along with it. January offers the opportunity to ride this magic carpet, but it also offers the potential for a sudden reversal of fortune.
It is the potential for a sudden reversal that makes the analysis of January behaviour difficult.
Most times, markets show early warning signs of reversals. Typically, they develop over weeks and months.
None of these signs currently appear on the major US indices.
Sometimes, the markets reach a decision almost overnight and correct quickly as the fairy dust turns to dross. This may be one of those times, although it is devilishly difficult to identify them in advance.
However, there are some behaviours that provide a warning signal on a tight time frame. They give little time for contemplation or confirmation, calling as they do for rapid reaction.
Mirage of economic strength
Ruchir Sharma, chair of Rockefeller International, warned that “the mother of all bubbles” is due to pop soon as US outperformance has been inflated by massive amounts of debt which has created a mirage of economic strength.

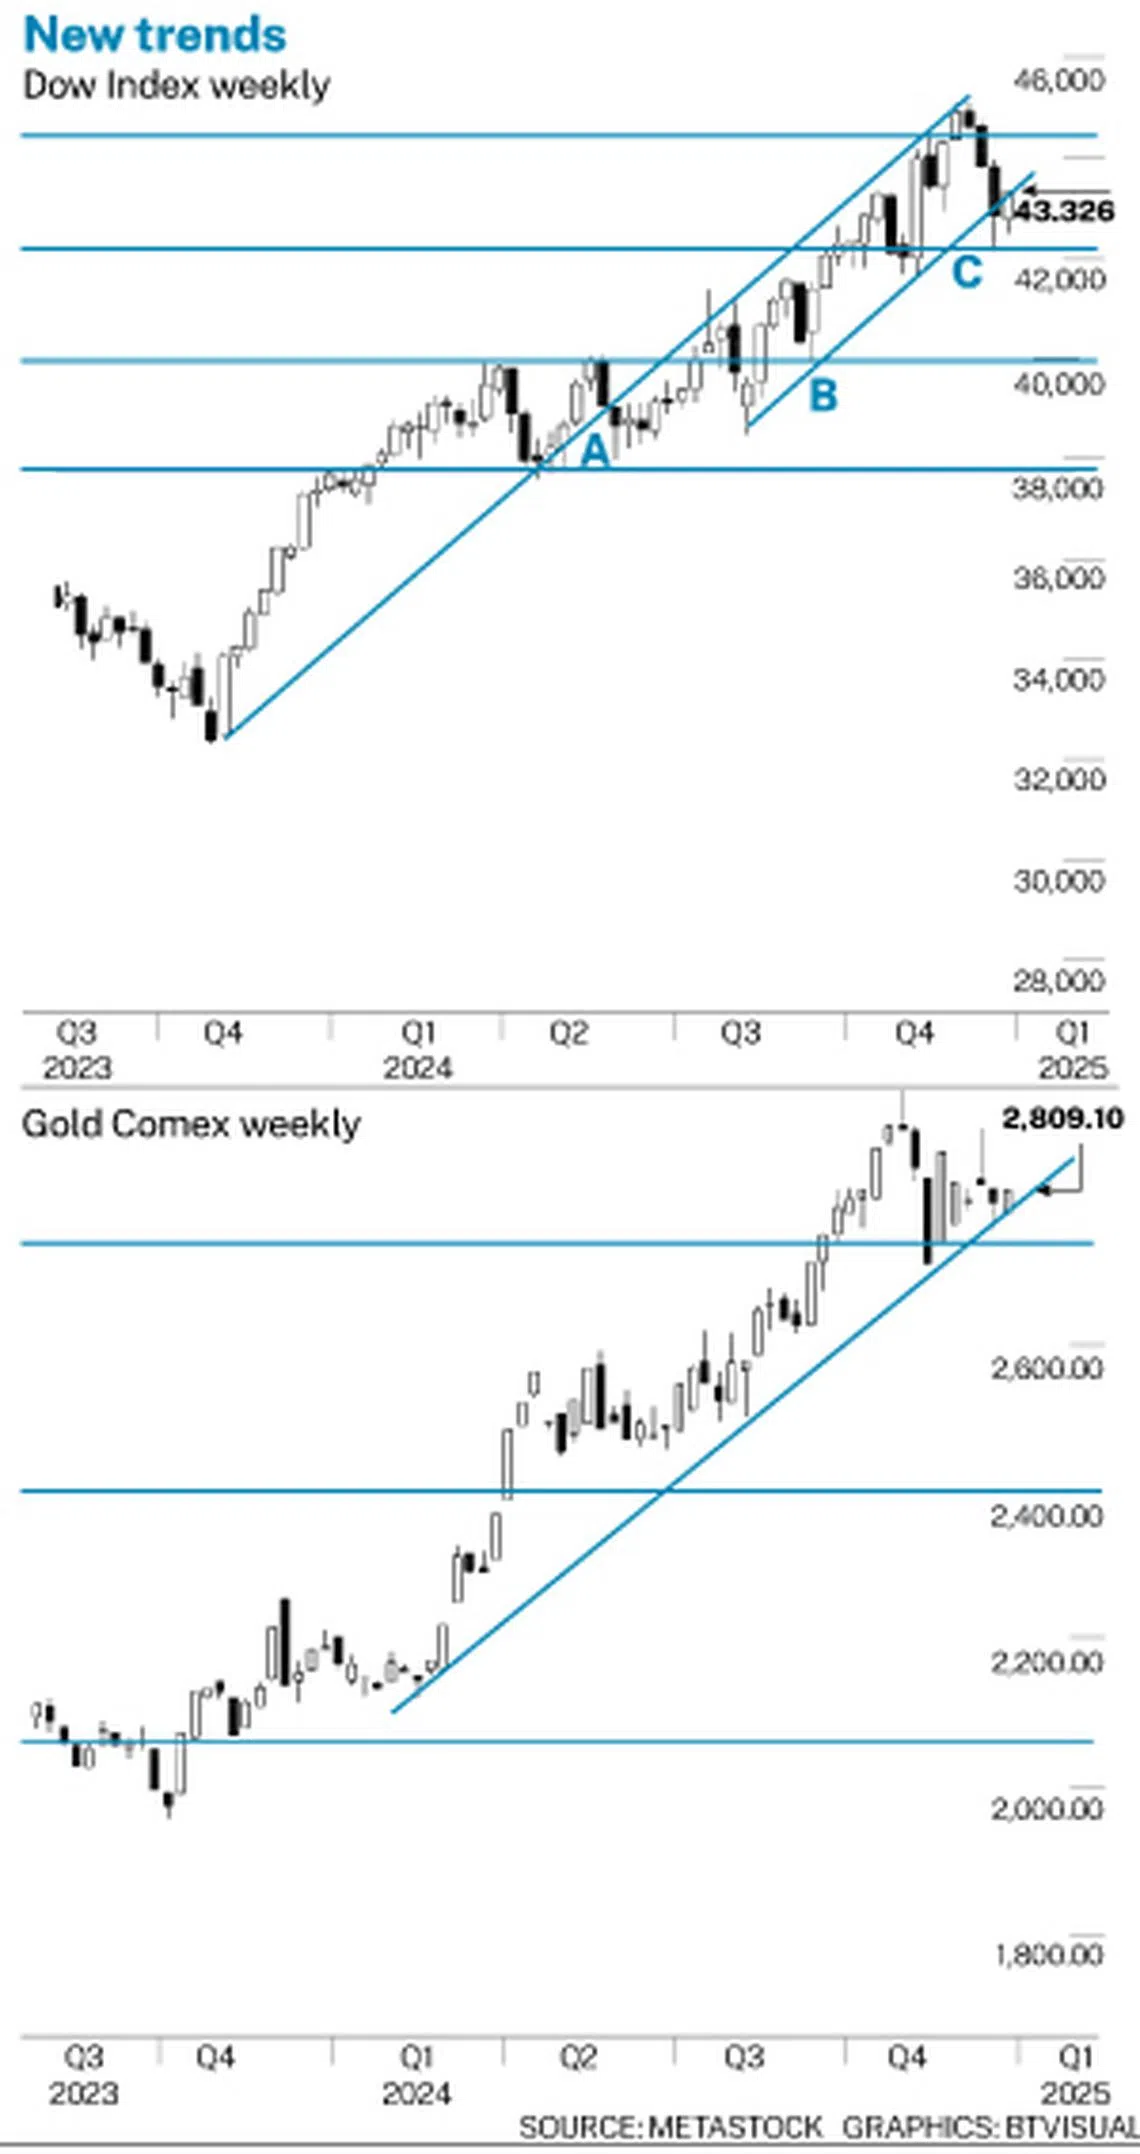
The weekly chart of the Dow Jones shows some support for this conclusion. In May 2024, the index dropped below trend line A. In the following months, trend line A acted as a resistance level, capping the rises in the market.
In August 2024, a new parallel uptrend line was plotted as trend line B. This acted as a broad support level. We can certainly quibble about the exact placement of trend line B, but we cannot quibble about its general role as a support feature.
In late December 2024, the Dow dipped below uptrend line B. The index rebounded from the support feature created by the trading band line C. The pullback moved within the limits of the trading bands, and appeared to confirm the continued strength of the uptrend.
The rebound rally shows the potential to use trend line B as a new resistance feature. The behaviour of the market has the potential to replicate the action that followed the trend line break at point A.
A bullish rebound and trend continuation is confirmed with a move above the trading band resistance level near 44,435. This gives a continuation target near 46,700.
A change to a new downtrend is confirmed with a close below trading band support near 42,195. This gives a downside target near 40,000.
The Dow chart sets the upper and lower targets, but it does not provide good clues as to which direction the market will move. This indecision is marginally bearish simply because it is indecisive – the market is not convinced that Trump’s solutions are easy.
Gold is usually the anchor that counters nervousness. Hence, the pullback from the high near US$2,945 and the testing of trend line support seems inconsistent with market nerves. A break below the trend line, and a break below trading band support near US$2,735 signals a change in trend.
They also signal increasing comfort with Trump’s simple solutions because it suggests there is no longer need for the safe haven offered by gold.
In this sense, Trump may be good for the market, but less helpful for gold.
Silencing the bears
A sustained break below the trend line signals the end of this uptrend with initial support near US$2,600.
A successful rebound from these support features has an upside target near US$3,100 and beyond that, US$3,450. These levels are calculated by projecting the width of the trading band. This projection method is an estimate, and while it is better than guesswork, it is not necessarily a high probability result.
If the mother of all bubbles is due to pop soon, then a successful rebound rally in gold will provide a precursor warning. On both the Dow and the gold charts, there are no patterns of behaviour that strongly suggest the development of a trend reversal or a change in trend.
Investors remain alert for these patterns as Trump proceeds with his easy solutions to difficult problems.
Both charts suggest that the Trump victory has – for the moment – silenced the bears, so the market may be prepared to take this moon shot.
One way or the other, it is likely to be a wild ride.
The writer is a financial technical analysis specialist, equity and derivatives trader and author. He has developed leading technical indicators used by investors in many markets.
Decoding Asia newsletter: your guide to navigating Asia in a new global order. Sign up here to get Decoding Asia newsletter. Delivered to your inbox. Free.
Share with us your feedback on BT's products and services
TRENDING NOW

Yeoh Pei Xien: YTL’s third-gen scion with a pastor’s heart

Singapore banks’ battle for wealth talent goes beyond private bankers

Car dealer charged in S$1.1 million tax evasion case involving Porsches, Ferraris, Rolls-Royces

A ‘shadow bank’ hiding in Singapore’s Little India casts light on financial services gap