Pricking the equities bubble
It’s close to being popped. Successful investing requires factoring in significant events and analysing them rationally, to chart a path through news and innuendo

“BY the pricking of my thumbs, Something wicked this way comes,” mutters one of the witches in Shakespeare’s play, Macbeth.
Investors are wondering if the US market bubble has been pricked, even though we are still two months out from the October when markets traditionally shudder. The sage of Omaha, Warren Buffett, has halved his stake in Apple.
We do not need the three witches to compile a list of fearful omens. It is remarkably easy to line up a list of looming disasters from the prospect of a wider war in the Middle East and its impact on oil and shipping costs. The doom sayers can add civil unrest in the UK, the prospect of a contested election outcome in the US, and the inevitable ramping up of a trade war with China that comes on top of increased militarisation in the South China Sea.
Fears of a US recession after the sell-off of the Magnificent Seven and the destruction of the yen carry trade are also seen as market disasters.
Investing success rests on a less-hysterical analysis of events. By all means, investors need to be cognisant of significant events, but they also need to consider them in a rational manner, free from the superstitions of dire predictions like those made by the three witches in Macbeth.
It is useful to step away from the daily twitches of fear and emotion, and consider the weekly index charts. This longer perspective strips out the immediate background noise.
The current pullback of around 25 per cent on the Nikkei 225 is larger than the 11 per cent fall in October 2008, and the 10.6 per cent fall in March 2011. The speed of the fall was unexpected, but as the weekly chart shows, the fact that the index fell was not unexpected.
The Nikkei has been defined by the single uptrend line that started in November 2023. This acted as a support feature until April this year. Following the fall in April, the trend line acted as a resistance feature, capping the recovery rally. This is often a signal of weakness, so in this sense, the retreat was not unexpected.
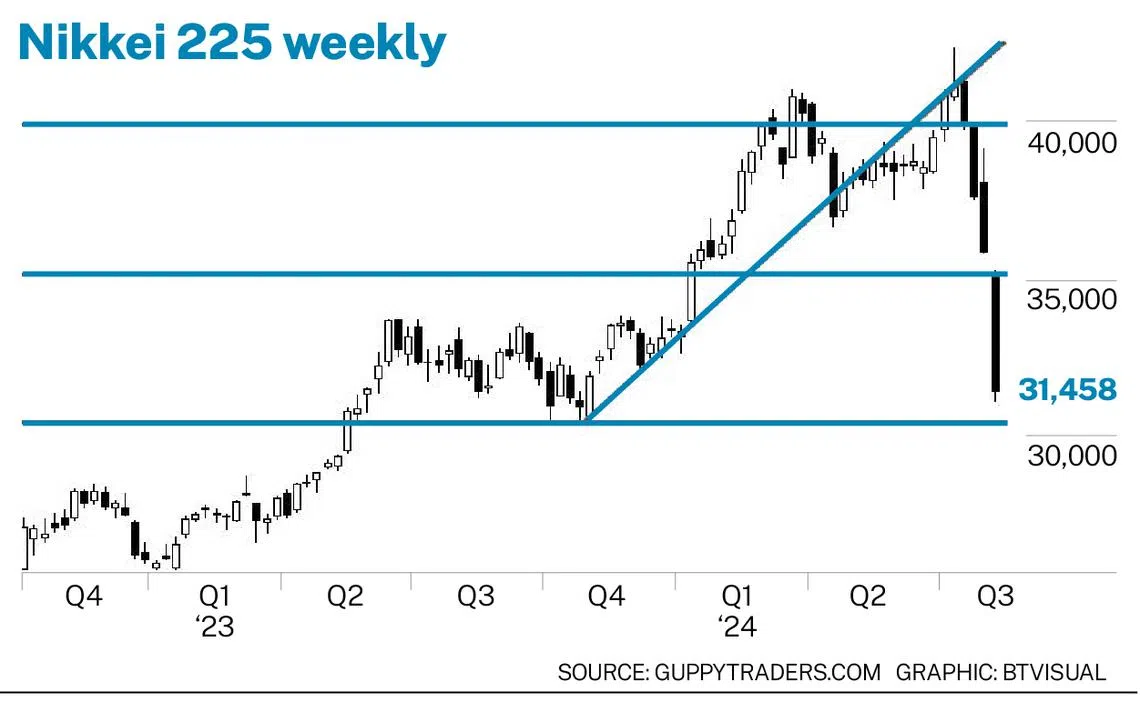
As with many global indices, the Nikkei rise is defined by trading bands. The support feature near 35,200 failed to hold. The support levels are calculated using the width of the trading bands. A fall below this level has a target near 30,500.

Investors were watching for the development of a more reliable end-of-uptrend development. This should be the head-and-shoulder trend reversal pattern, but it did not develop. The Nikkei collapse came out of nowhere, triggered by over-dependence on zero interest rates.
Investors should wait for confirmation of this development, just as they wait for the same confirmation in US indices.
The weekly S&P 500 chart provides a picture of the broader US market. In April 2024, the S&P broke the long-term uptrend line with a brief retracement below 5,000. The subsequent uptrend peaked in July at 5,670, and is now retreating towards the support level near 5,060.
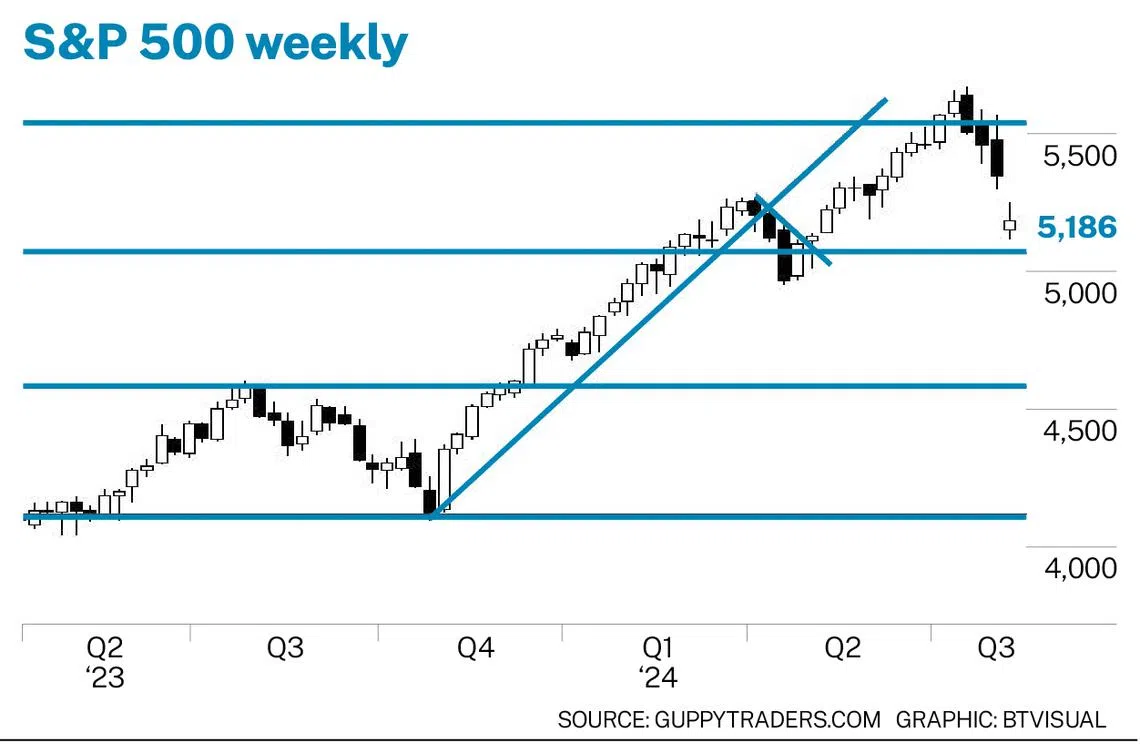
In common with many global indices, the chart is defined by a series of trading bands, all of equal width. These trade bands have set support and resistance levels for both the sustained rise starting in October 2023 and the subsequent retreat and rebounds. This pattern suggests the market can fall to around 5,060 and then develop a rebound rally.
This is the critical development. A rebound rally from 5,060, if followed by a retreat and rally below 5,060, would create a head-and-shoulder trend reversal pattern. The downside target for this pattern is around 4,500. A continuation of the rally rebound has a higher target near 6,100, calculated using the trade band width.
Its far too early to call this head-and-shoulder chart pattern, but the nature of the rebound from support is a critical test to watch.
There are some who suggest that using chart analysis is akin to listening to Macbeth’s three witches. There are some analysts who use charts in this way, attempting to provide predictions of the future with certainty.
However, chart analysis is best used to provide a reliable probability framework for establishing an objective context in an emotional world of news and innuendo. It helps investors to understand where the key turning points are located, and which type of activity will confirm one course of action or another. Being forewarned with good analysis is forearmed, and that makes for better investment decisions.
The market bubble is dangerously close to being pricked. The witches chanted their warning of “Double, double toil and trouble: Fire burn, and cauldron bubble”. It provides an uneasy background for markets in the coming weeks.
The writer is a financial technical-analysis specialist, equity and derivatives trader and author. He has developed leading technical indicators used by investors in many markets.
Decoding Asia newsletter: your guide to navigating Asia in a new global order. Sign up here to get Decoding Asia newsletter. Delivered to your inbox. Free.
Share with us your feedback on BT's products and services


