S&P 500 points to strong underpinnings for US stocks and economy
The broader S&P index provides a better guide to the health of the US economy and its prospects than the Dow Jones Industrial Average which reflects 20 companies

WHEN it comes to investment decisions, debates between the never-Trumps or forever-Trumps are pointless. Still, some policy positions by the president-elect cannot be ignored.
This includes a determination to levy new tariffs on many products and to increase tariffs on Chinese products. Both incoming president Donald Trump and outgoing office holder Joe Biden believe that tariffs are an antidote for the ills that plague the United States. Many agree with Trump, but others point ominously to the impact and consequence of the Smoot-Hawley tariff acts of 1930 which many historians conclude was an accelerant towards World War II.
The task for the investor is not to agree or disagree with the validity of the policy, but to develop strategies that will minimise any harmful impacts.
The same thinking can be applied to the latest Trump pronouncement that countries looking to work with Bric (Brazil, Russia, India and China) currencies or alternatives to the US dollar will be subject to 100 per cent tariffs.
This is a more dangerous extension of his previous policy because those countries will stop buying US Treasuries that currently fund the extravagant American lifestyle which relies on never-ending debt. The result of unfunded debt is hyper-inflation.
We can speculate on the potential impact and choose our preferred narrative.
But ultimately, it is the behaviour of the market – where opinions are backed by money – that will be the deciding factor in the fortunes of investors.
Investors need to listen when capital runs away, and that is where chart analysis lends a useful hand.
The broader S&P index provides a better guide to the health of the US economy and its prospects than the Dow Jones Industrial Average which reflects 20 companies. A stumble or a fall in the S&P 500 provides the alert signal for investors.
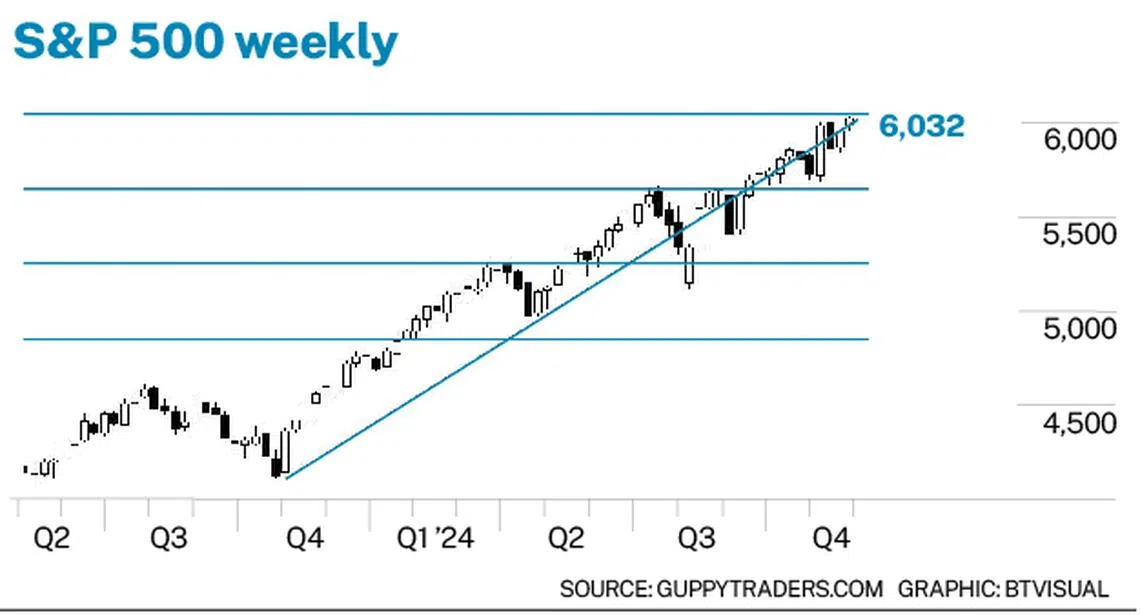
The uptrend line is plotted through the middle of the index activity and defines the general direction of the trend. That comes as no surprise. The horizontal lines are all the same width. These are trading bands, and set the initial targets for each trading band breakout. These bands set the next target near 6,450 but they do not help us to understand how those targets will be achieved.
What is significant on this chart is what is missing – which are any patterns of behaviour that suggest the development of a trend reversal or a change in trend. Investors should stay alert for these patterns, but there is no urgency. These reversal patterns usually develop over weeks and months.
The S&P 500 indicates a strong bullish market with no hint of serious weakness. Pullbacks represent buying opportunities.
Former Chinese premier Li Keqiang said that rather than industrial statistics, he preferred to look at electricity demand as a more accurate measure of economic health.
Economic statistics are constantly retrospectively adjusted in the US; so the reliable equivalent measure of industry activity is oil and its price.
The Nymex Light Sweet Crude is a measure of global demand. Some prefer to use the Brent crude oil price, but the difference in price is unimportant. What is important is the price behaviour.
The Nymex oil chart is dominated by horizontal lines of support and resistance. Support is near US$64 and resistance is near US$93. Movement between these levels may give traders a good 45 per cent return but that is of less interest to investors.
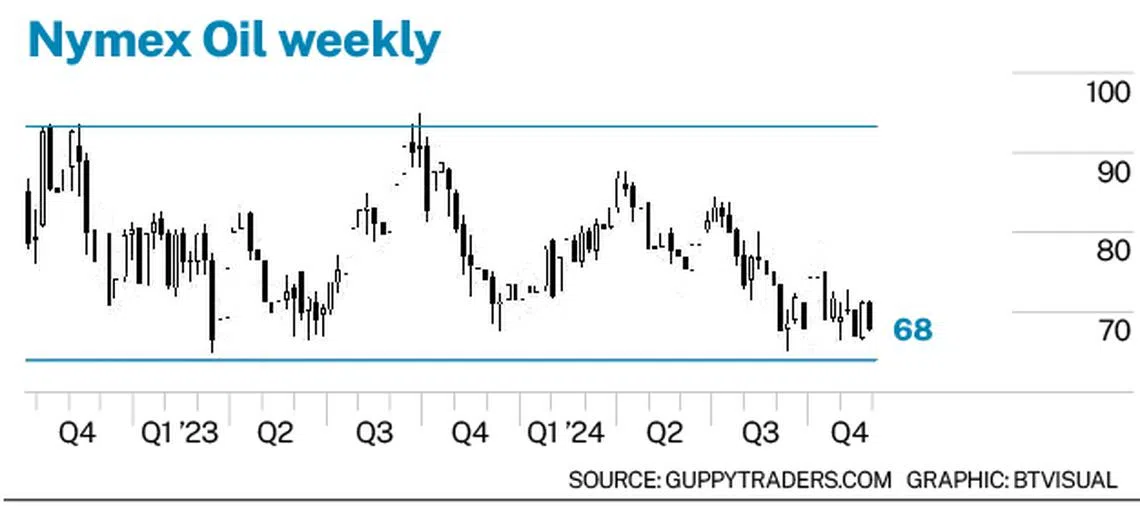
The relative stability of rally-and-retreat behaviour over the past two years suggests stability in economic development and demand. The rallies that have developed have often been in response to flare-ups in the Middle East. They are not in response to substantial changes in demand.
A rally from current prices has an upside target near US$93 but is more likely to pause around previous highs near US$80.
The chart suggests there is a low probability of a price shock driven by massive increased demand from an accelerating US or global economy. The chart does not suggest a higher probability of a global collapse, led perhaps by the US.
The S&P suggests that the Trump victory has trumped the bears in the market. The oil price, subject to a wider range of influencing factors, suggests no expectation of significant change in demand.
The writer is a financial technical-analysis specialist, equity and derivatives trader and author. He has developed leading technical indicators used by investors in many markets.