US recession potential: Mixed signals from Nasdaq and gold
Nasdaq chart suggests an end to rate hikes, but gold price points to need for more caution

THERE is a lot of interest – pun intended – in the question about whether the US economy is expanding or not. The Federal Reserve seems determined to bring the economy to heel by raising interest rates.
It’s a uniquely US problem and solution, because of the way interest rates are structured in the US. Most home mortgages have fixed 20-year and 30-year rates. Business loans have variable rates, so the impact of changes in interest rates falls most heavily on business investment and operations, rather than on consumers.
In many other countries, home mortgages have variable interest rates. When rates rise, households and consumers are hit hardest. It’s an important difference in the way interest rate rises impact different economies.
Foreign banks that have borrowed in US dollars – often to fund their expanding home loan business – are most at risk in this interest rate war. This is because the cost of their funds is increasing and must be passed on to borrowers in the form of higher interest rates. The same dynamic drives official government interest rates that are trapped by action taken by the US, even if it is not appropriate to their own economic situation.
Hence, there is a high level of interest – pun intended again – in what the US market is telling us about the potential for further rate hikes.
Remember, rising interest rates are designed to slow economic activity, so we expect the major indices to fall. A pause in interest rate hikes, or a reduction, boosts the economy, so we would expect the indices to rise. In a strong economy, defensive commodities such as gold become less important as a hedge, and we expect to see a decline in the gold price.
Unfortunately, the charts of the Nasdaq and gold show a significant contradiction in expected outcomes.
The Nasdaq has three analysis features. The first is the head-and-shoulder pattern that indicates a trend reversal following the peak in an uptrend. This is shown as points A, B and C. The height of the pattern is measured and projected downwards. The fall in the Nasdaq reached the projected target level, tested this support several times, and now has developed a rebound.
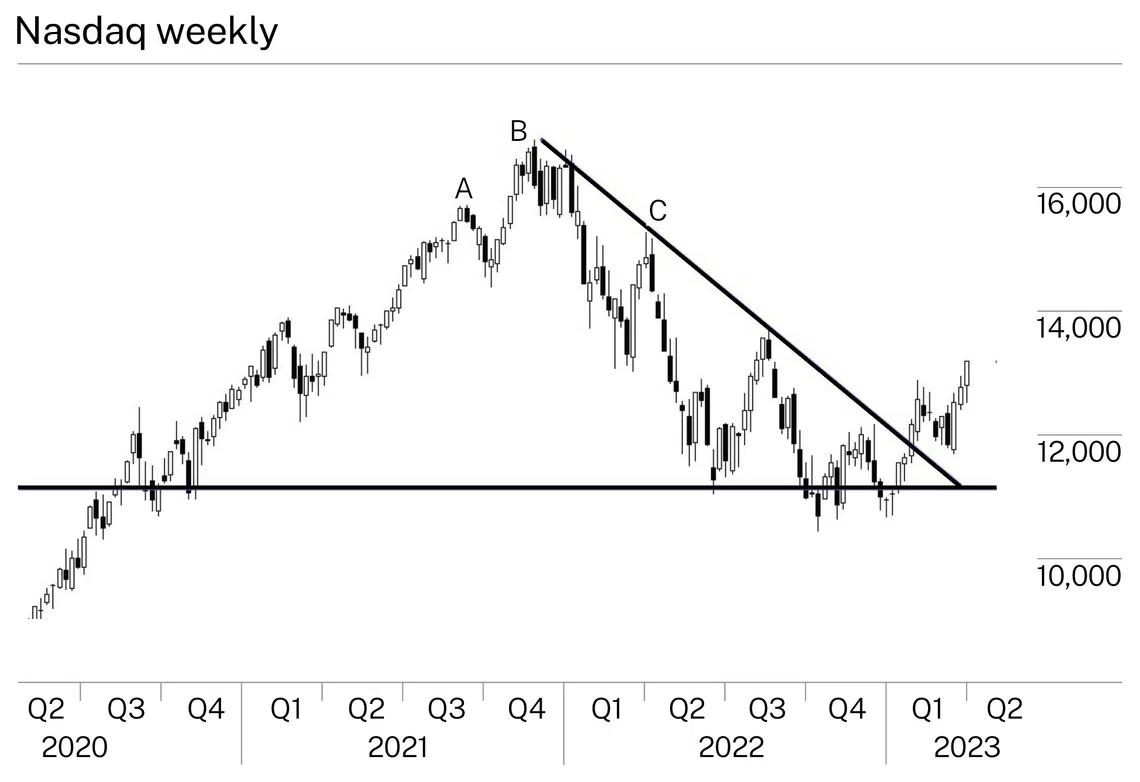
The second feature is the way the Nasdaq fall is defined with the downtrend line. A breakout above the downtrend line is usually considered bullish.
The third feature is the combination of the trend-line breakout following a successful testing of the head-and-shoulder pattern targets. This combination is generally a strong bullish indicator. The immediate upside target is near 14,500.
The Nasdaq chart supports the expectation that interest rate rises have, or are about to, come to an end, and this will usher in a new burst of economic growth.
The gold price chart also shows a breakout, in this case above the long-term resistance level near US$2,050. This is the strongest breakout seen in more than two years. Starting in 2020, gold has remained trapped in a sideways trading band between support near US$1,700 and resistance near US$2,050.
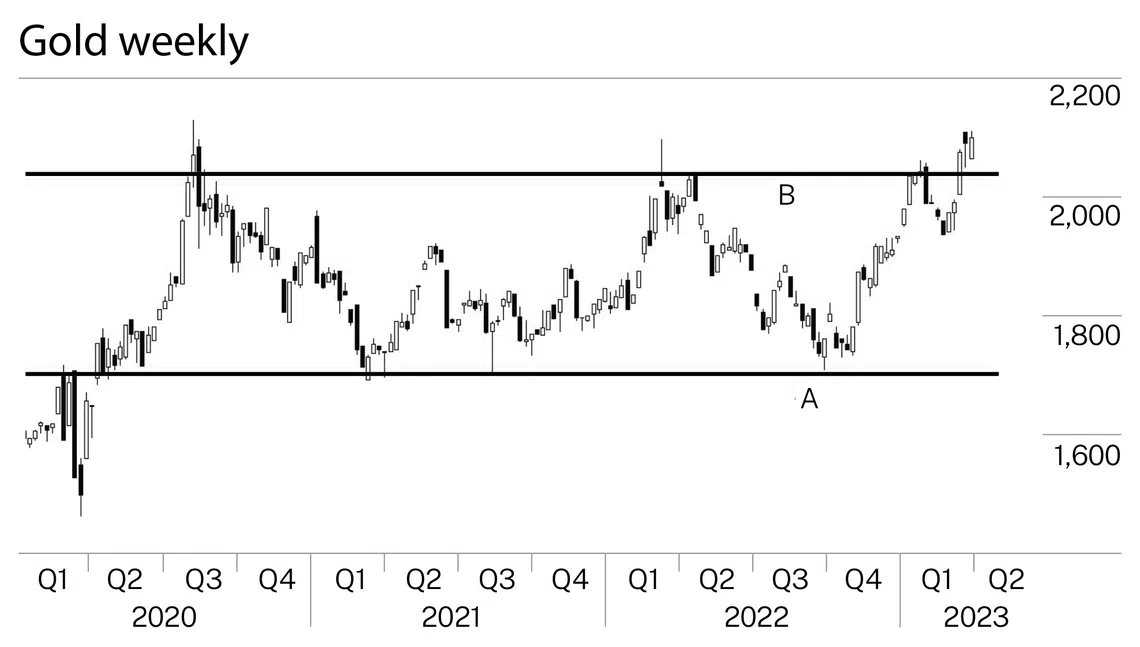
Trading bands are useful because they enable price projection based on the width of the trading band. The gold trading band is US$350 in breadth. This suggests an upside target near US$2,400 for gold. These measured move calculations do not enable a time calculation.
However, historical movement, with the trading band from support to resistance, has taken around six months. It is reasonable to anticipate a similar time period will be required to reach US$2,400 following the current breakout.
The gold chart suggests that further interest rate rises are expected, along with stronger economic slowdown. The breakout implies gold bugs are hunkering down, following economist Nouriel Roubini’s advice that markets should brace for a meltdown as stressors lead to a “doom loop” in the economy.
This contradiction in index and commodity behaviour suggests a significant level of confusion and uncertainty in the financial markets about the direction of future interest rate moves and economic stability. This makes opening new longer-term investment positions a bit of a gamble, based on hope for change rather than tracking the reality of change.
On balance, it’s the active market trading in the Nasdaq that provides a more reliable signal. But the behaviour of gold prices suggests a higher level of caution is needed in making long-term investment decisions.
The writer is a financial technical analysis specialist, equity and derivatives trader, and author. He has developed several leading technical indicators used by investors in many markets.