

Waiting on fear: Bearish outlook for FTSE 100
September has a dismal record of crashes; Nasdaq may correct and for London FTSE, a likely downtrend

WELCOME to the most dangerous month of the year for markets – but no, it’s not October.
It’s true that October often includes some substantial dips, but most times October closes higher for the month than it opened. This isn’t so for September, which has developed a dismal record of crashes. The catastrophe in October starts in September. Sometimes, this fall extends into early October, but the month is most often characterised by a rebound rally that leads into the Christmas cheer.
While October may have been the worst month in the market several decades ago, it has been replaced by September as traders anticipate the October collapse.
Success in the markets does not come from following what most people do or believe, because most people lose money. Uncommon results do not come from common thinking.
During the period, traders can position themselves to go short and investors can get ready to buy into stocks that suffer a temporary dip in otherwise strong uptrends. No matter which approach you use, it is essential to understand how far the index or stock could reasonably be expected to fall before a recovery develops. There are two keys to this analysis.
The first is the identification of support areas and an assessment of their strength. The second is to identify any end-of-trend chart patterns. If these are found, it suggests that any price fall is more likely to be permanent rather than transitory.
We apply this two-step analysis to the Nasdaq and the London FTSE.
The two most powerful trend reversal patterns are the head-and-shoulders pattern and the rounding top. Neither of these patterns appears on the Nasdaq chart so to that extent, investors can breathe a sigh of relief.
However, it’s not a clear bullish run. Currently, the Nasdaq is bouncing off the uptrend line that started in January 2023. A continuation of the rebound has resistance near 15,750 and then again near 16,600. None of these features gives the Nasdaq much room to move in a September retreat.
A fall below the trend line has weak support near 13,700. The more reliable support is much lower, near 11,200. This combination of factors suggests the Nasdaq could experience a significant September fall with an October rally recovery, using the value of the uptrend line as a resistance feature.
The London FTSE 100 is also free of end-of-uptrend chart patterns, but the index behaviour is much more dismal than for the Nasdaq.
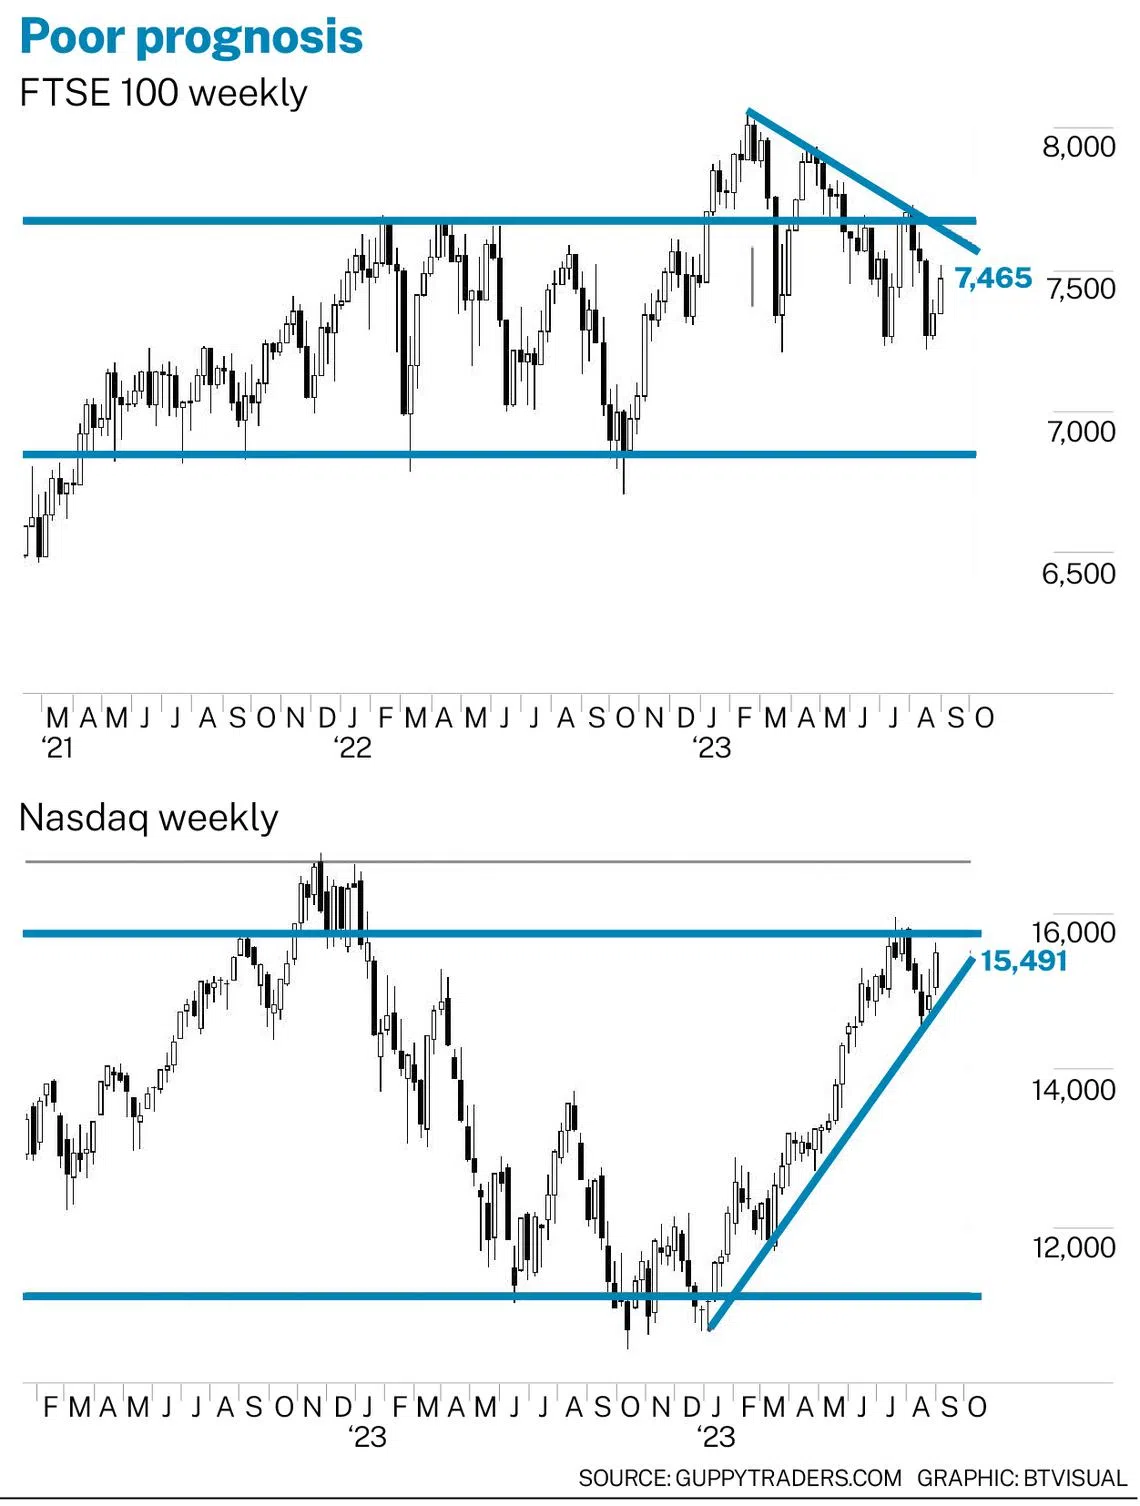
The FTSE has been stuck in a prolonged trading band starting in 2021. It’s a long-Covid effect where the market has essentially stagnated. The upper or resistance level of the band is near 7,650. The lower support level is near 6,800 and this is the target for any September retreat.
Unlike the Nasdaq, the FTSE is already in a downtrend and this makes it more vulnerable to September jitters. The combination of the resistance level near 7,650 and the value of the downtrend line makes for a serious resistance feature.
The balance of the market is bearish so this makes it easier for the September bears to push the market towards historical support near 6,800. An extreme October dip could push the market to the next support level near 6,500. This seems a low probability outcome given the consistent strength of support at the lower edge of the trading band.
The US market remains bullish and this suggests it is largely immune to any long-term distress caused by a September sell-off. The UK market has an established gloomy outlook so it is a high risk that any September sell-off could accelerate the existing downtrend.
The writer is a financial technical analysis specialist, equity and derivatives trader, and author. He has developed several leading technical indicators used by investors in many markets.
TRENDING NOW

He built the Vingroup empire. Now South-east Asia’s richest man is handing some key roles to his sons

US dollar falters after Iran’s offer to reopen Hormuz sends oil lower

Temasek’s Wan Chee Foong to helm PIL, Lars Kastrup to be board adviser

Despite the de-dollarisation debate, demand for dollar liquidity in Asia is growing

