Bearish investors live in hope as markets rise
Market bears are excited by rising inflation in Japan which have the potential to drive the yen up and encourage Japanese investors to exit US investments as this will cause a market collapse and deliver profits to them

DeeperDive is a beta AI feature. Refer to full articles for the facts.
WHEN market bears scan the horizon, they see nothing but doom and gloom. It has been that way for months. The so-called “Liberation Day” provided a flash of lightning portending an approaching storm – or so they believed.
Most recently, their attention has swung towards Japan. With debt-to-GDP at 260 per cent, an ageing population and rising interest rates, fears of a Japanese default are intensifying. A shock to Japan’s bond market could ripple globally – further spiking US yields, trashing the S&P 500 and triggering panic.
Inflationary threats are rising in Japan and putting pressure on the Bank of Japan to raise rates. This has the potential to drive the Japanese yen much higher, which will encourage Japanese investors to move out of US investments.
The market bears are excited, sticking to their hope that the market will collapse and their bearish positions will deliver good profits.
Over the next 10 years, the US will add another US$20 trillion in debt. Foreign buyers may not keep buying US debt, so just who will buy it remains an open question. It is a bears’ delight.
In the US, surging bond yields will pressure real estate with higher mortgage rates. Stretched equity valuations will see price-to-earnings multiples compress significantly.
Navigate Asia in
a new global order
Get the insights delivered to your inbox.
A significant drop in US asset prices will drag the US economy into a sharp downturn. This risk is amplified by historically high household exposure to equities and record levels of leverage.
The bears are living in hope but the S&P 500 has resumed an uptrend towards the point where the bears will have to cover their shorts, direct their cash reserves to the bulls and squash the gold bugs.
US President Donald Trump sees nothing but good news, and the equity market seems to agree with him as the S&P 500 tests the rounding-top pattern and approaches old highs.


The rounding-top pattern has two parts. The first half is defined by the index activity. The second half is projected forward and waits for further index activity to confirm its accuracy. The S&P 500 chart is unusual in that the index collapsed from the middle section of the pattern and quickly achieved its projected targets. Most often, the retreat comes during the second half of the pattern.
As always, the recovery is confirmed when the index is able to move above the projected right side trend line curve. This breakout displaces the rounding-top pattern and its influence.
The current behaviour of the S&P 500 is more akin to a rally than a new trend. A rally is a fast upward move with no distinct retreat and rebound points. A trend includes retreats and rebounds which act as anchor points for a trend line. The index behaviour around the projected value of the rounding top may set a valid anchor point for a trend line.
A breakout above 6,000 confirms continued bullish pressure. A trade-band projection gives a target near 6,200. A move below 5,700 signals continuation of bearish pressure with support near 5,200.
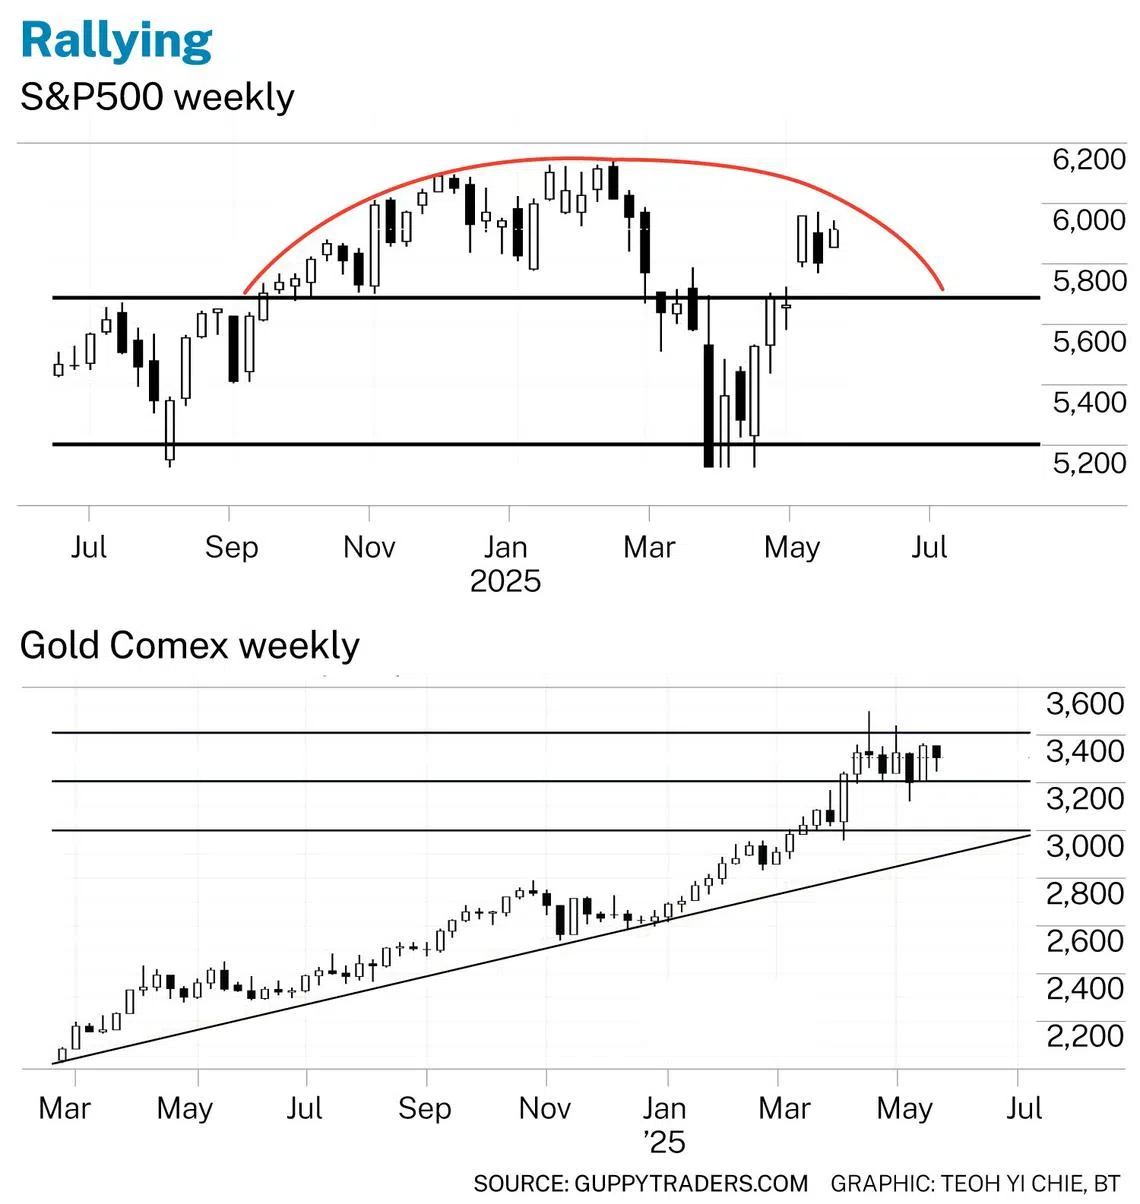
Traditionally, gold is a hedge against risk. The Comex gold chart shows just how much hope the bears have borne in recent times, driving prices higher in anticipation of an equity market collapse. Instead, both gold and equity markets have shown a steady rise, contradicting the usual risk relationship.
There are two immediate features of concern in the gold chart. The first is the bubble behaviour. This appears when the price moves substantially above the underlaying trend line. Gold could fall by 12 per cent to US$2,900 and still remain consistent with the long term uptrend.
The second feature is the consolidation in the trading band between support near US$3,200 and resistance near US$3,400.
Gold tends to move within well-defined trading bands so a breakout above US$3,400 has a target near US$3,600. A downside move below US$3,200 has support near US$3,000.
The uptrend with gold has paused, and this suggests a level of indecision about broader market direction. The consolidation suggests that the bears are losing confidence but have not yet given up hope.
The bears have lived with hope for an extended period, stashing cash and hoarding gold. Now they are hoping the so-called bond market vigilantes will ride to their rescue, crashing markets and driving gold higher.
There is a limit to how much hope a bear can bear while bulls charge away.
The writer is a financial technical analysis specialist, equity and derivatives trader and author
Decoding Asia newsletter: your guide to navigating Asia in a new global order. Sign up here to get Decoding Asia newsletter. Delivered to your inbox. Free.
Copyright SPH Media. All rights reserved.


