

Finding markets’ floor
Markets slosh around with waves of money and can rise far higher or fall further than we can imagine

MARKETS don’t move in straight lines, and neither are they random. Markets slosh around with waves of money and can rise far higher than we can imagine.
When money evaporates, markets fall, again much further than we can imagine. The fall is usually arrested at floor levels which can be anticipated based on past market behaviour. These floors are essential investment decision points.
Above all, the market is rational. No investor believes they are making an irrational decision. They deal rationally with their money. Although market volatility may appear irrational, it is driven by decisions made rationally.
The trader and the investor need to know when to hold, when to fold, and when to run. Technical analysis of charts help formulate those decisions.
Understood and applied correctly, a chart is a diagram of ranked probabilities. Terms such as support and resistance are areas where there is a higher probability that the market will pause. That knowledge gives the investor time to consider the best course of action.
When we work with market indexes, we accept a sleight of hand. Every index is based on survivor bias. This means that, over time, the index inevitably rises. This is often confused with the incorrect idea that stocks, if held long enough, will inevitably rise; that is the greatest investment myth of all.
The index always rises over time because losers are regularly culled from it, and winners are added. The index is therefore always an index of winners, which are chosen every quarter or half-yearly.
The Dow Jones Industrial Average is an example of this survivor bias. Today, it contains just one stock from the Dow of 1959.
Chart and technical analyses give investors the tools to understand the most probable outcomes. This includes setting price targets and picking up the early indications of trend change. Armed with this information, the investor can make a more informed decision.
Chart analysis is not about finding the lows and highs of each trend change. It is about faster recognition of when the highs and lows have been reached, so investors can get out with substantial profits.
Helping readers to understand how to use these tools to make more informed decisions has been the objective of these columns over the past decade. In this final column, we look at the two most important markets in the world, the Dow and Shanghai Index.
Dow Jones Industrial Average
Although not exact placements, the series of trading bands on the chart has defined the Dow’s rise over 2024 and 2025. The Dow has made new highs during this period, and a trading and projection method is used to define each pause area in the trend. This is a useful analysis tool, although it does not define how the trend will develop.
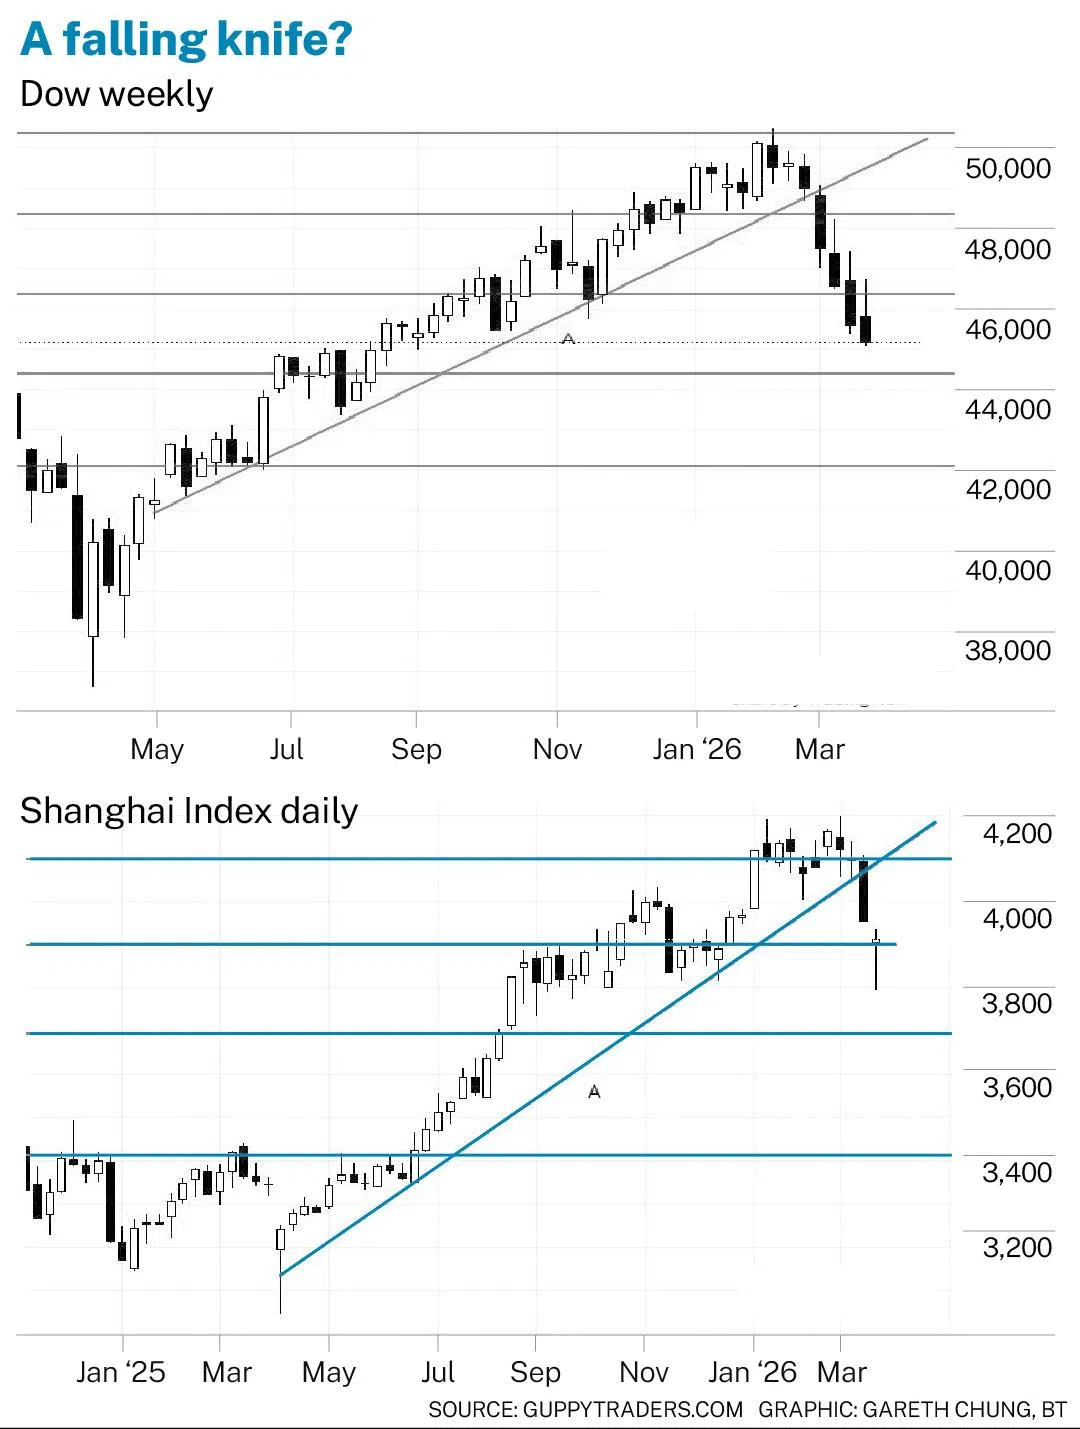
The 2025 Dow uptrend was relatively stable and defined, with the uptrend line A on the weekly chart. As each projected trading band target level was reached, the market paused for a short time to consolidate around these levels.
When the Dow broke below the uptrend line, these levels were potential support areas. The fall below 48,400 was the first indication of a change in the uptrend. This was confirmed with the rapid fall below 46,400 in early March.
The next downside target is near 44,400. This was a resistance level in late 2024 and early 2025. A fall below this level has support near 42,100. This was a support level in late 2024 to March 2025.
This behaviour suggests that the Dow may consolidate between 42,100 and 44,400 before developing any new trend behaviour.
Rather than attempting to catch a falling knife (or market), investors will wait for proof the floor can hold. Existing investors can use these as pain points to decide if they can bear the loss if the market moves to these support levels.
Shanghai Index
The Shanghai Index has been slower to break its primary uptrend, but it has done so decisively with the fall below 4,100. The market is holding near support at 3,900, although it dipped to 3,800 before recovering.
In recent months, the index has spent some time consolidating, or moving sideways at each trading band level before developing a new trend. The index spent two months around 3,900 before the breakout move to 4,100.
This suggests there is a possibility the index will oscillate around the 3,900 level before resuming trend behaviour. Any upside move finds resistance near 4,100.
A downside move has technical support near 3,700. This is a calculated level using the width of the trading bands. The level was not a barrier when the market was rising, so at best it would be a weak support level when the market is falling.
The most significant historical support level is near 3,400. Moving to this level represents a substantial collapse of the Shanghai Index. A fall of this magnitude could also move as low as 3,150. This was a significant level in 2024 and 2025.
In both the US and Chinese markets, the key feature for investors is consolidation around a support level. When markets recover, they do so from established support levels. Rebounds may occur from a point between these support levels, but they are rarely sustainable.
This is the last column from the writer. He is a specialist in financial technical analysis, equity and derivatives trader, as well as an author.
TRENDING NOW

Grab CEO’s wife Chloe Tong on life with Anthony Tan and finding her purpose

Canada is upping oil flows to Asia, but South-east Asia’s refineries aren’t ready to handle them yet

TRX and Labuan IBFC join forces to boost Malaysia’s regional financial ambitions

Crystal Jade Fine Dining faces charge for failing to file income tax return on time

