Make hay while the Trump shines

[SINGAPORE] The Trump trend is your friend until it isn’t. That sounds like a Taoist I-Ching tautology, but it’s not. Ukrainian President Volodymyr Zelensky knows what this means – investors are about to find out.
It means that although the current, prolonged uptrend in the market is continuing, it is also unreliable, with the potential for a sudden change without warning. This is not the same as a bearish outlook, because the bears are hankering for a market crash as a means of making money.
A sudden change in the uptrend includes a painful but temporary retreat, a sudden slowing of momentum, or a radical readjustment in trend behaviour. All of these options have the potential to do serious damage to investment portfolios.
As Zelensky found, the sudden Trumpian tempest leads to a reset and new conditions which may not be as favourable as in the past. When trading the current market trend, either as a new investor or when adding to existing positions, investors need to be alert for trend changes which challenge their assumptions.
Until then, investors aggressively build positions or add to existing positions when the sun shines.
However, they cannot assume the current trend will continue indefinitely. Investors need to ask: “How do we recognise when the trend is changing?” The answer to this question provides the methods to continue to enjoy the profits from the uptrend, and avoid holding on as a market retreat turns into a collapse.
The first focus is obviously the equity market, but attention also needs to be paid to associated markets such as the US Dollar Index. Home to the once-Magnificent Seven stocks, the Nasdaq has clawed its way back above the long-term uptrend line. The trend line now acts as a support feature.
The activity of the Nasdaq is defined by trading bands which impose both resistance and support barriers to the uptrend movement.
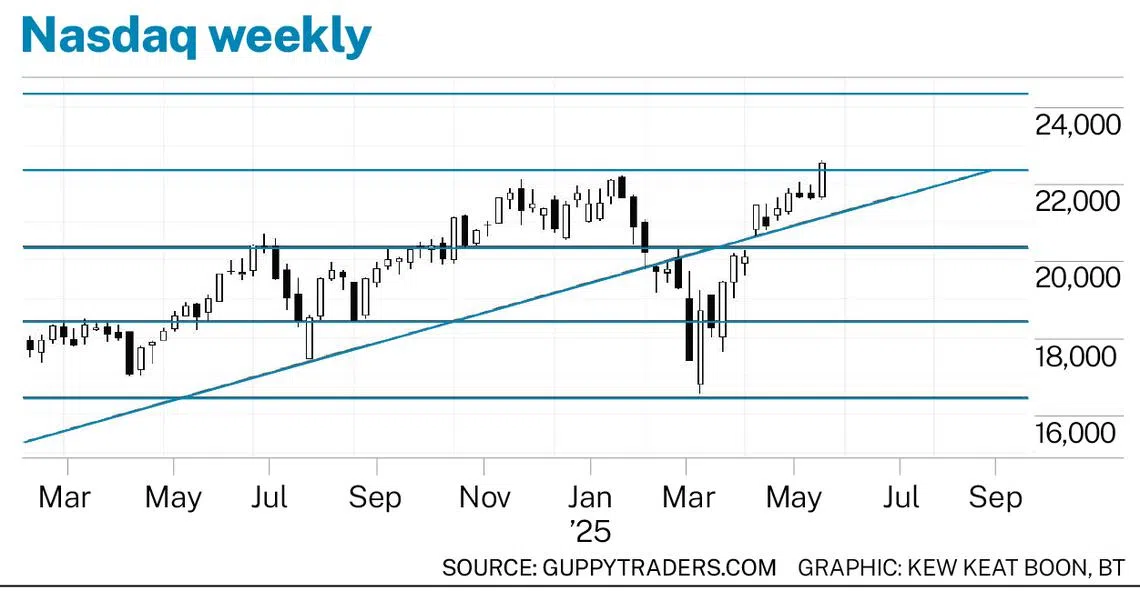
Using the trading-band price-projection target, the next objective for the Nasdaq is near 24,380. What’s needed to reach that target is for the trend line to continue to offer support for any market retreat. Once above the current resistance level near 22,370, it is reasonable to anticipate that any retreat would find support at this level.
SEE ALSO

Any fall below 22,370 has support at the value of the trend line. The strength of the uptrend is confirmed when the trend line passes through the resistance level at 22,370, around Oct 6.
As seen in March, a move below the trend line has downside targets established by the previous trading-band support levels.
Currently, there is no indication of any end of uptrend pattern developing. This includes patterns such as rounding tops, double tops and other trend-exhaustion behaviours.
This suggests any retreats are likely to be temporary, offering opportunities to add to existing positions at bargain prices before the uptrend resumes.
There is considerable debate about whether President Donald Trump is delivery-forcing US dollar weakness, or whether it is an unintended byproduct of his policy approach. Our concern is to establish the persistence of the trend and its potential pause and reversal levels.
The notable feature is the collapse of the US dollar, shown on the DXY monthly chart where the price scale is in cents. Under usual circumstances, the chart suggests the fall should have at least paused, if not stopped, at around the support level at US$1 parity. Instead, it plunged below this level before staging a weak recovery, followed by another major plunge to around US$0.97.
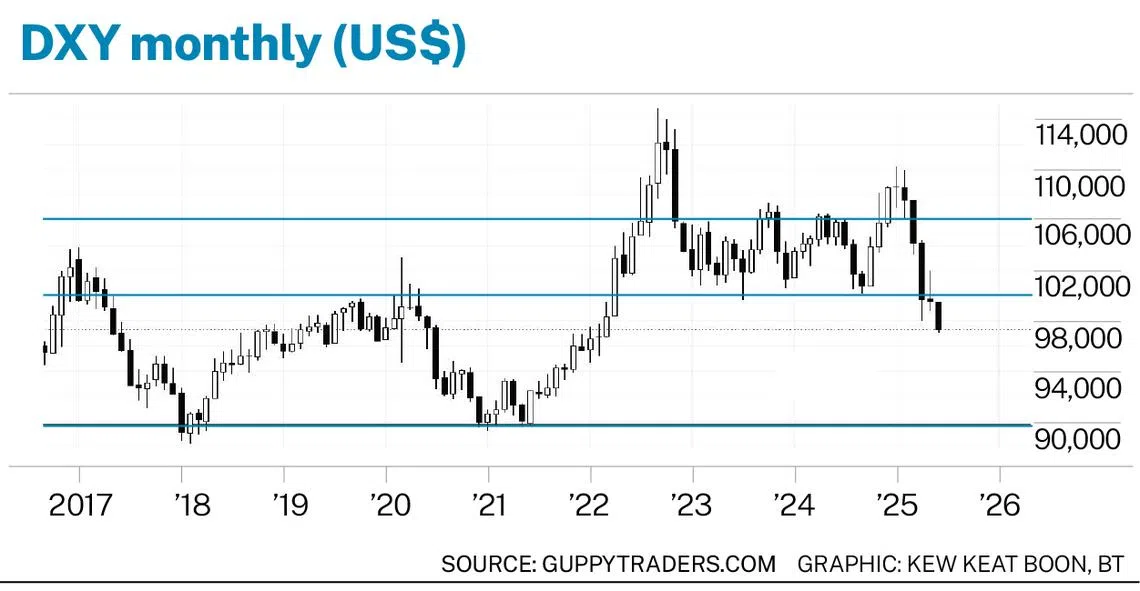
The significant feature on the DXY chart is that this is no strong historical support until US$0.90. There is a weak support level near US$0.93. In either case, they both represent a significant fall in the US dollar.
This is not trending behaviour. This is the opposite of a fast-moving rising rally – an avalanche. It’s the collapse that can quickly swallow a chair of the Federal Reserve. It’s an avalanche that is difficult to stop and reverse once it moves below the well-established and tested parity level.
The monthly DXY chart carries an important behavioural characteristic. Reversals from the current price direction can be both rapid and large. This suggests the fall towards US$0.93 support could take as little as two months, or about the same length of time as the fall from US$1.06 in March to US$1 in April.
The US dollar at US$0.93 or lower is a significant change in market and trade relationships, which will inevitably impact equity markets. Investors don’t fight the trend, but while the sun shines, they also keep an eye open for the patterns of behaviour which increase the probability of a major change in trend direction.
The writer is a financial technical analysis specialist, equity and derivatives trader and author
Decoding Asia newsletter: your guide to navigating Asia in a new global order. Sign up here to get Decoding Asia newsletter. Delivered to your inbox. Free.
Share with us your feedback on BT's products and services


