

Is this time different for the 60/40 portfolio?
We should actually anchor our expectations on the longer-term historical evidence

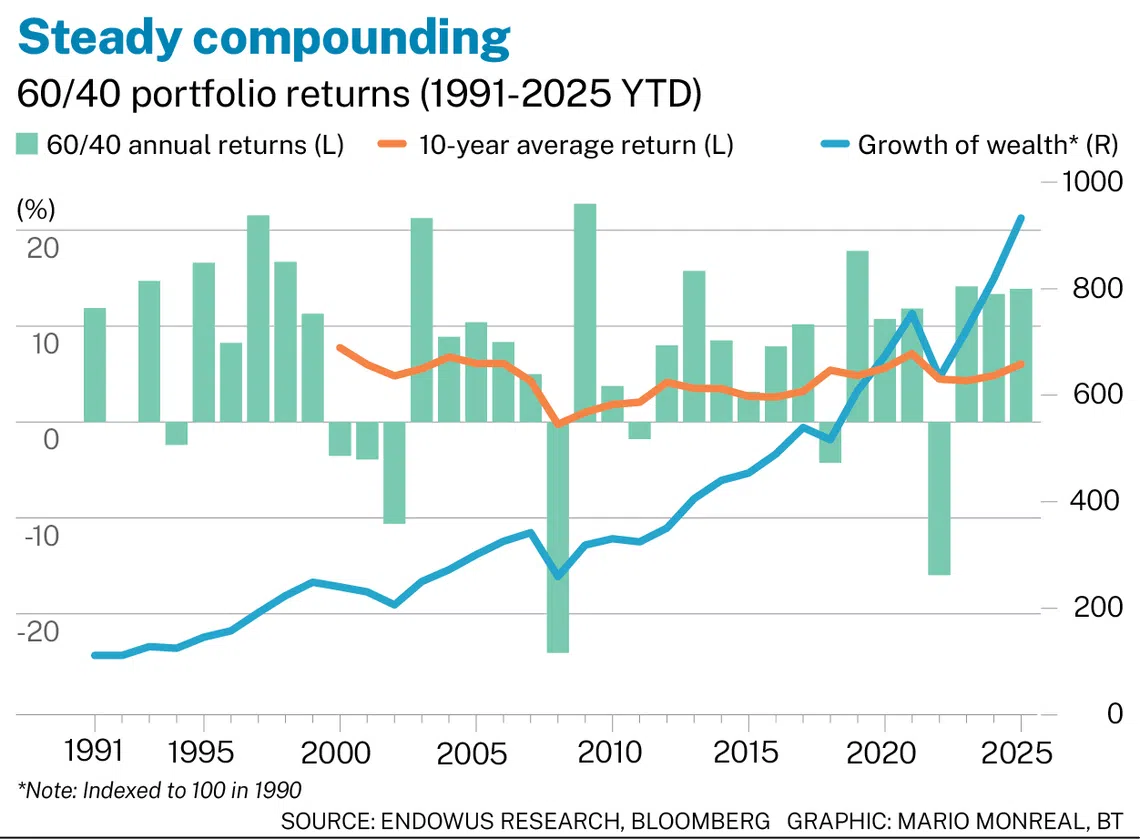
THE 60/40 portfolio (60 per cent global equities, 40 per cent global bonds) has delivered 8 per cent in annual returns over the past decade.
The average return in the past five years was 7.4 per cent. The 10-year, 15-year and 35-year periods gravitate towards the 7 per cent mark, sometimes rising to 8 per cent or falling closer to 6 per cent.
In the past 35 years, the 60/40 portfolio is up 833 per cent. Those are some pretty impressive numbers and seem to go against most people’s expectations.
There have been many articles about the demise of the 60/40 portfolio in recent years, mostly because of its anaemic returns during 2021 to 2022. However, since the end of 2022, the 60/40 portfolio is up 40 per cent. Is this normal and is this recovery sustainable?
60/40 works because of fixed income
Investors like the balanced portfolio because of the upside from equities and, as we know, stock markets rise over the long term. This is why we start with a higher equity allocation to compound growth.
However, investors do not choose 100 per cent equities because of the volatility of the stock market. In particular, we hate to see large negative returns. This is why fixed income is added as a hedge.
Hedging works only when there is a negative correlation between asset classes. That is, when equities fall, fixed income should rise to cushion the losses.
Has fixed income done its part? The answer to that is a resounding yes.
60/40 a great portfolio – most of the time
Global stock and bond market indexes were incepted in 1991, which gives us 35 years of data. About two-thirds of the time, or over 23 years, both stocks and bonds were up. In those years, the portfolio averaged annual returns of 12 per cent.
There were three years (1999, 2013 and 2021) when stocks were up, but bonds were down. This was also a good outcome, as stocks rose much more than bonds fell. In fact, bonds showed an average decline of minus 2.2 per cent, while stocks rose by a whopping 23 per cent.
Normally, the economy and earnings are strong and support the stock market. However, concerns about an overheating economy and/or rising inflation leads to rising interest rates, which hits fixed income.
But the 60/40 portfolio did even better in those three years than when both stocks and bonds were both up, averaging a phenomenal 12.9 per cent annual return.
So, in 26 years, or three-quarters of the time, there was a happy scenario where the 60/40 returned over 12 per cent. This again shows how equities performance provides enough upside even in a 60/40 portfolio.
When this compounds over time, the returns could be quite significant, as seen in the chart.
Role of fixed income in 60/40
Let’s turn to the role of fixed income in the 60/40 portfolio, and whether it did what it was supposed to do historically.
In 31 of the 35 years, global bonds posted a positive return. Hence, the first point to make is that fixed income returns are pretty stable, with much less volatility than stocks. Almost 90 per cent of the time, bonds provide a positive contribution to the portfolio, regardless of what equities do.
The second point may surprise many. In 12 years, or almost a third of the time, bonds actually generated a higher absolute return than equities. So, fixed income often contributes positively to the return of the portfolio.
Finally, the third and most important point. In eight of the nine years that equities fell, fixed income returns were positive. Fixed income more than played its part in dampening the negative effect of equity market volatility, especially at times when it was most needed. Diversification therefore has given us a better risk-adjusted return.
What about the remaining one year?
What was the exception?
Only once in 35 years were stocks and bonds both down together. In 2022, equities were down by minus 19 per cent. Bonds posted double-digit negative returns of minus 11.5 per cent, followed by minus 1.3 per cent in 2021, resulting in two consecutive years of negative fixed-income returns – also a first for fixed income.
The only other times fixed-income markets were down were in 1999 (minus 5.2 per cent) and 2013 (minus 0.2 per cent).
Returns turned negative in 2008 during the global financial crisis (GFC) and in 2020 during the Covid-19 pandemic, but in both cases they recovered, ending up 3.9 per cent in 2008 and 5.4 per cent in 2020.
A brief history of the bond bull market
It’s easy to forget that fixed income enjoyed an unprecedented period of good returns during a 50-year bull market since interest rates peaked in the 1970s, and continued to meander its way down to zero in 2008, and again in 2020.
The expansion of global free trade, lower cost of manufacturing and distribution, and a structural decline in costs and inflation gave free rein to central banks to cut interest rates.
However, it wasn’t just the disinflationary effects of globalisation, but also the deflationary shocks of the world lurching from one financial crisis to the next.
The crises spanned the 1997 Asian financial crisis, the savings and loan crisis in the US and the collapse of Long Term Capital Management, the bursting of the dot-com bubble in 2000, the GFC, the 2013 European debt crisis and finally Covid-19.
All these prompted central banks, especially the US Federal Reserve, to take interest rates to zero.
Inflation started rising post-Covid, accompanied by a sharp rise in global geopolitical tensions causing major disruptions to global supply chains. The upshot has been a new regime of higher-for-longer inflation and interest rates that led to the 2022 shock.
After peaking at the end of 2023, interest rates have been steadily, albeit slowly, coming down. The US was the last to cut rates last year and despite an extended pause, has recently started a new rate-cut cycle that is likely to extend into 2026.
If the 2021-to-2022 period of sharply negative bond returns was an anomaly, then we are now entering a period when bonds benefit from both a high starting yield and the prospect of falling interest rates driving capital gains.
Fixed income can once again play the role it has historically played so well – serving as a natural hedge against equity volatility.
Why this time is different
The most dangerous four words in investing are “this time is different”.
As a long-term investor, you would realise that history doesn’t repeat itself, but it often rhymes. Recency bias is also at work when we anchor our expectations against what has happened most recently. But we should actually anchor our expectations on the longer-term historical evidence.
The 60/40 portfolio is such a case. We should not put too much weight on the 2021-to-2022 experience, but look at 1991 to 2025.
The 60/40 portfolio has generated 13.8 per cent per annum in returns in the past three years. Even if this is unsustainable, a return to the long-term average of 7 to 8 per cent is an attractive proposition as equities reach new highs and fixed income looks more attractive.
The writer is co-founder and group chief investment officer at Endowus, a digital wealth platform with over S$12 billion in client assets across public, private markets and pension (CPF and SRS)
TRENDING NOW

Once staunchly pro-China, Malaysian Chinese businesses are now distancing themselves from Beijing

Grab CEO’s wife Chloe Tong on life with Anthony Tan and finding her purpose

Could stablecoins be the future of money?

ST Engineering opens tech-focused aircraft maintenance facility in Changi; to create over 500 jobs

