Upward trend intact for S&P 500 and Shanghai index
Both markets have scaled new highs and look set to continue this climb
PAUSING for a moment on the side of Huangshan mountain in China, I peered through the clouds down the more than 1,000 metre drop. It was a breathtaking and slightly terrifying view. Looking up, there were still more steps leading to the next peak beyond what was already a giddy high.
In the safety of my office I get a similar feeling when I look at the S&P 500 index and to a lesser extent, the Shanghai Index.
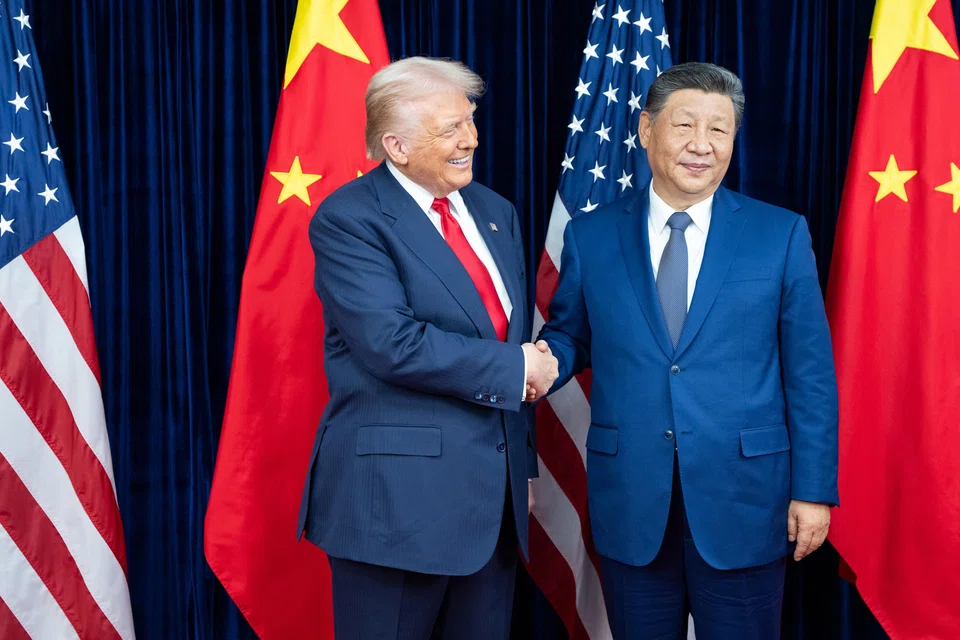
It is appropriate to examine these markets following the recent Apec summit in Korea and the outcome of the trade talks between China President Xi Jinping and US President Donald Trump. The Americans remain culturally oblivious to the nuances of the gift of face given to them by the Chinese. President Trump believes he has a resounding victory, placing the meeting outcome as a 12 out of 10.
The US market will follow his script and move towards to new highs with a continuation of the general direction in the long term trend. Some may note that the Chinese readout of the meeting outcomes was quite different from that of the broader US media.
The US Department of the Treasury says China is to buy a minimum of 12 million metric tons of soybeans in the first season and a minimum of 25 million tonnes a year for next three years.
China’s says it will “scale up trade” in agriculture goods and provided no numeric targets.
It is no surprise that the China market is uncowed by the apparent “concessions” to the United States in relation to soybeans and rare earths. The Chinese market recognises these concessions for what they are. It is a skilled application of “creating something out of nothing” where the adversary develops a misconception about the true situation. This is strategy 7 of the infamous and ancient 36 Strategies.
It costs China nothing to resume the import of soybeans, or delay any restrictions on rare earth exports.
However, both markets have scaled new highs and look set to continue this climb. The index charts provide a method to set the safety rails for any retreat and to project the potential upside targets.
The S&P 500 did have a minor stumble in October, but this was nowhere near the much-feared crash. The significant feature was the way the long term group of averages in the Guppy Multiple Moving Average (GMMA) did not compress in reaction to the retreat. This shows that investors remained confident in the trend so they rushed in to capture bargains. This bullish behaviour was reflected in the new highs achieved in October.
The support features for the S&P are the old resistance – now support level – near 6,650. This is also near to the upper edge of the long term GMMA.
The primary resistance feature is the projected target near 7,200. This is calculated by taking the width of the trading band and projecting it upwards. As the movement between 6200 and 6650 shows, this can be a slow and steady uptrend move rather than a fast rally.
The long-term uptrend line A is now acting as a resistance feature. This is a minor feature as it will soon cross the 7,200 level leaving that level as the major resistance point.
There is no indication of end-of-trend behaviour.
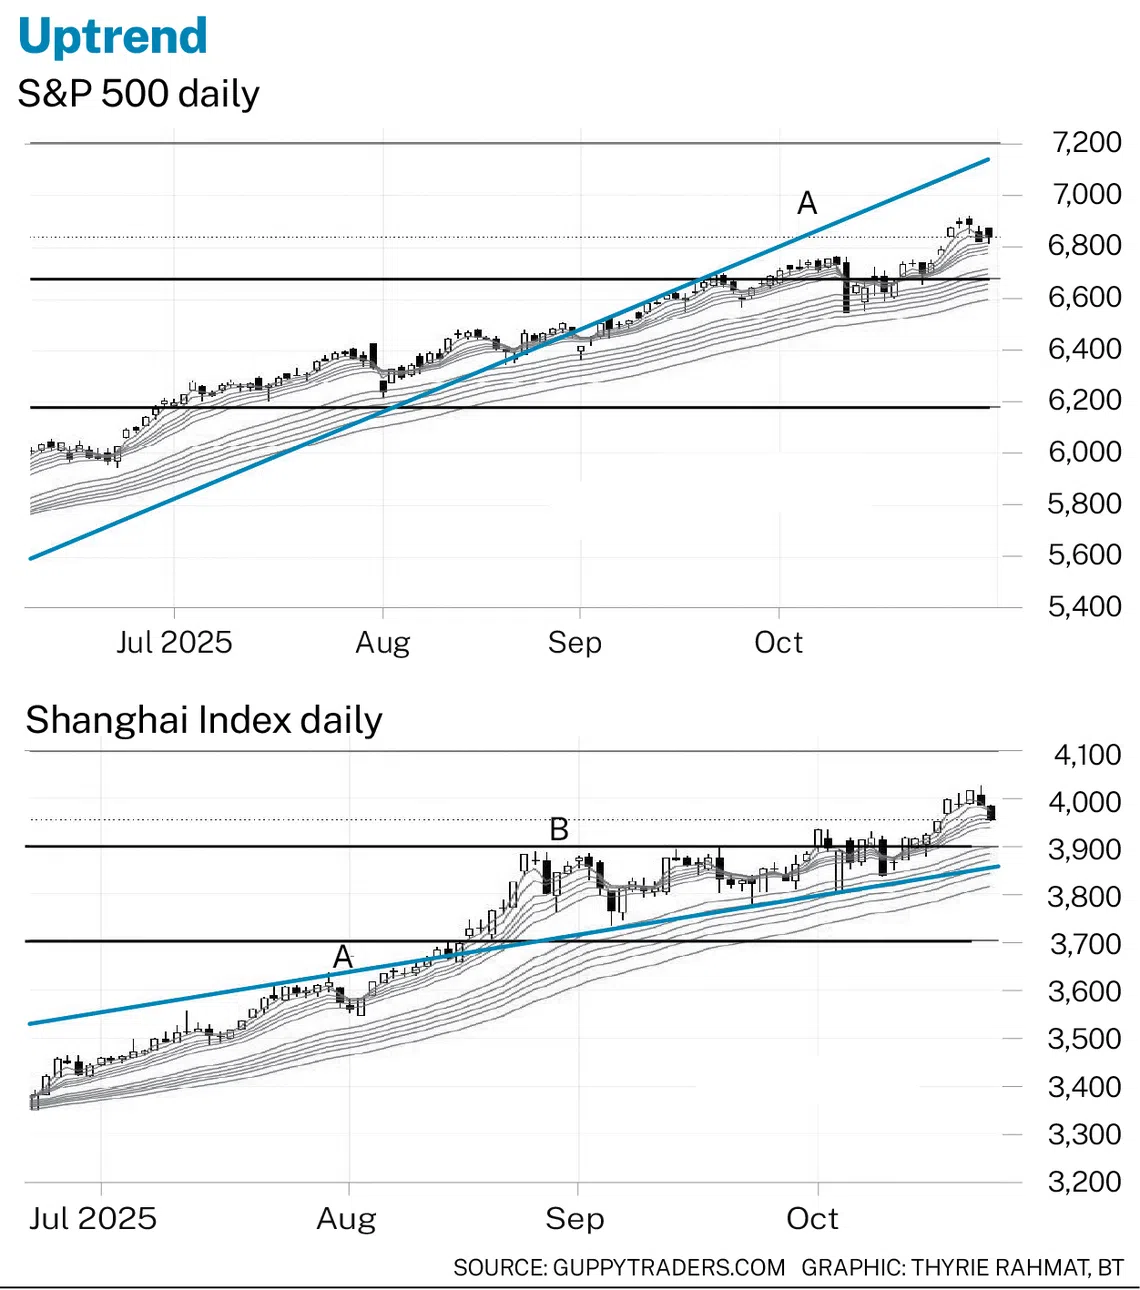
The Shanghai Index is a little more complex. It has similar features to the S&P 500 in terms of the behaviour of the long-term group of averages in the GMMA indicator. This suggests steady investor support for the trend where investors buy the dips because they believe the trend is strong.
The same type of trade band analysis is applied to the Shanghai Index. The price projection gives an upside target near 4,100. The index can retreat to 3,900 or 3,850 and still remain consistent with the long-term uptrend.
The additional feature on the Shanghai index chart is the upward-sloping triangle created by resistance line B and uptrend line A. The base of this triangle is measured and the value projected upwards. This gives a target value of 4,150 which is a little above the trading band price projection target.
This consistency of target values reached by two different calculation methods increases confidence in the continuation of the uptrend.
In both the S&P 500 and the Shanghai Index there is little evidence of end-of-uptrend behaviour. However, the retreat from the market peaks is unlikely to be as smooth as the cable car descent from the top of Huangshan.
The writer is a financial technical analysis specialist, equity and derivatives trader, as well as author