Adverse patterns of interest
The S&P 500 has developed a chart pattern that should frighten investors. This slow developing pattern allows investors to time the market.


THE threat of interest rate rises has a greater impact on global markets than the war in Ukraine. It’s sad but true.
The number to remember is 3650. Last month we wrote that a retreat from the S&P 500 index resistance feature is likely, and that this sets up the conditions to develop a head-and-shoulder trend reversal pattern. We suggested investors should ride the rally and tighten stops to protect and maximise open profits.
Why 3650? This is the value of the downside projection target on the S&P 500 index. The head-and-shoulder pattern is not an obscure figment of the analyst’s imagination. This pattern of behaviour is a reliable indicator of a change from an uptrend to a downtrend.
Its often said that you cannot time the market, but this statement is inaccurate. The head-and-shoulder reversal pattern develops over months. This pattern developed in late 2007 and was confirmed in January 2008. I noted the pattern during a CNBC interview and the pattern provided ample warning of a market collapse.
The current S&P pattern starts with a peak and retreat in September 2021. That is shown as feature A. The ‘head’ of the pattern – marked B – developed in January 2022. The subsequent retreat carried the index below the long-term uptrend line. The failure of the rally rebound – marked C - to reach previous highs, or break above the previous uptrend line confirmed a trend change.
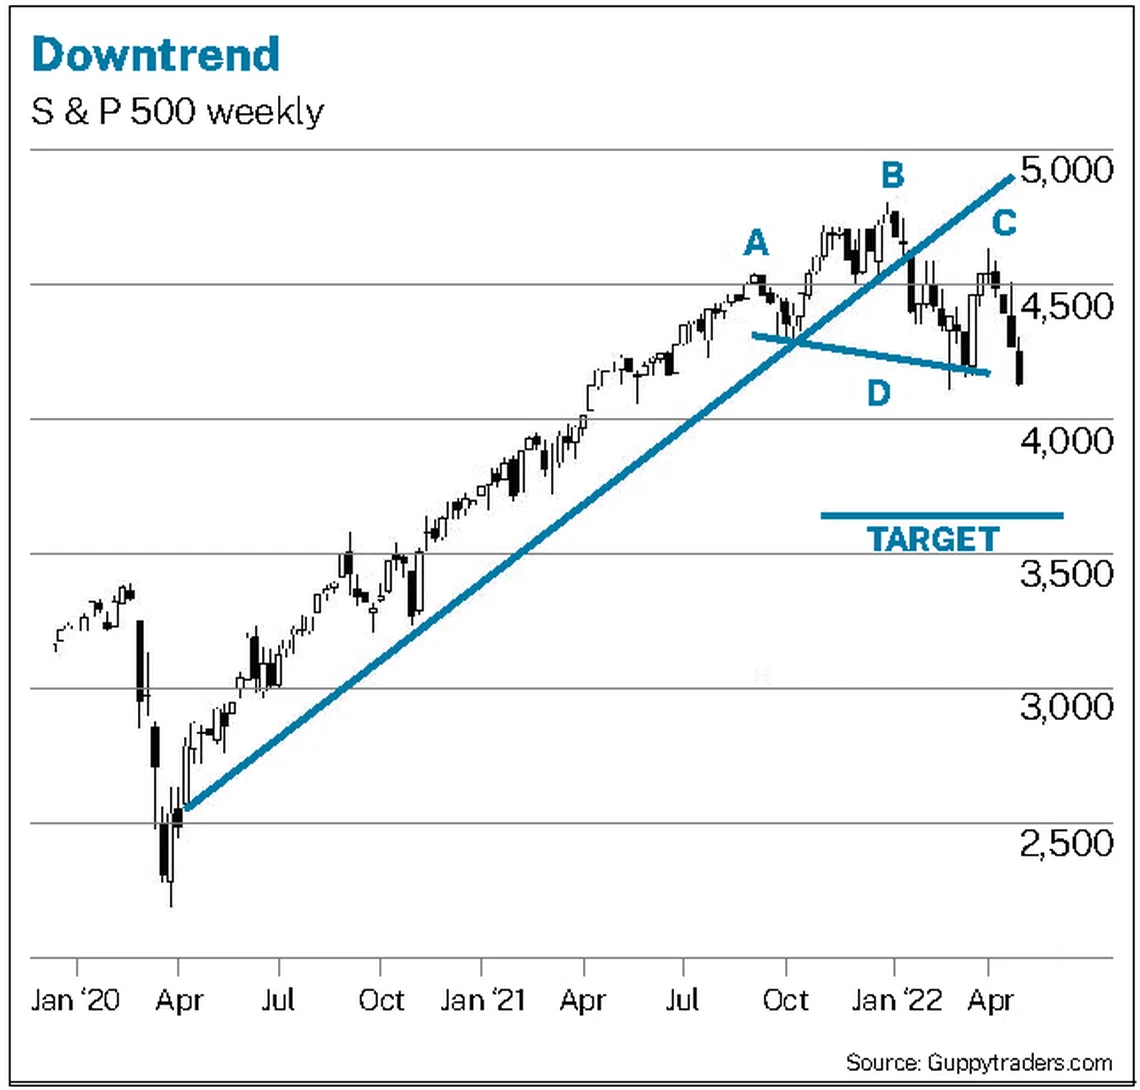
The combination of A, B and C created a head-and-shoulder reversal pattern on the weekly chart. The neckline of this pattern is shown in line D. The pattern is confirmed when the index retreats from the right shoulder – point C – and the value moves below line D. This has developed.
Navigate Asia in
a new global order
Get the insights delivered to your inbox.
The pattern not only confirms a downtrend and the need to exit long positions, it also sets a downside target. This is calculated by measuring the distance been the market high at point B and the value of the neckline – line D. This value is projected downwards to give a downside target near 3650.
The pattern tells investors it’s time to sell long positions and to wait for the market fall to consolidate near the target level of 3650, before opening new long positions. This is a slow-moving trainwreck so it’s possible to ‘time’ the market.
This market collapse is driven by the rise in inflation and the forecast rise in interest rates. Inflation has been blamed on the rising price of oil, but this claim is not supported by the price behaviour. NYMEX oil has retreated from its peak of around US$139 and is now using the upper edge of the long-term uptrend channel as a support feature. Oil has not quite returned to its normal trading pattern, but the idea that it was going to exceed S$180 and stay there has been dismissed.

The new China lockdowns are adding to the supply chain pressure. In the US it is this, plus the continued impact of Trump-imposed China tariffs, that is pushing up inflation. Oil prices have contributed, but at around US$100, they are not the primary driver.
The monthly chart of NYMEX oil shows that the current oil price remains within the price trading band that prevailed from 2011 to 2014. Inflation in this period was between 1.6 and 3 per cent. Oil prices at this level are not inflationary in themselves, and they are not an economy killer. Oil is a handy fall guy for 2022 inflation, but the chart price history does not support this vilification.
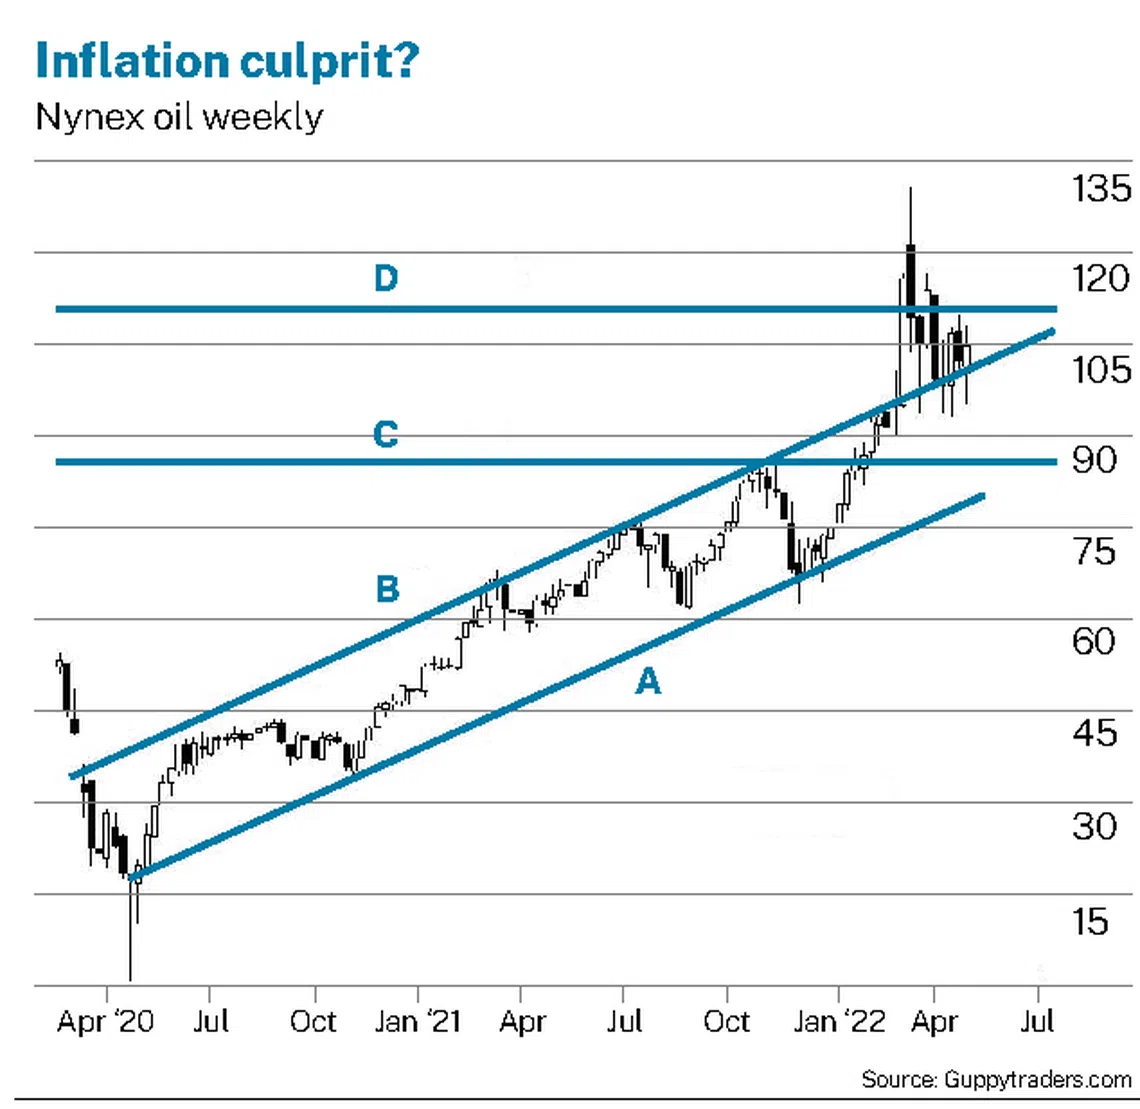
Lines D and C on the weekly NYMEX oil chart are the upper and lower levels of the oil price in 2011 and 2014. In March, price briefly popped above this upper trading band but then retreated to trade within the long-term trading band.
Starting in 2020 oil traded in an upward sloping price channel shown with trend lines A and B. The retreat in the oil price is using line B as a support feature. There is a high probability that price will continue to fall and resume its rally-and-retreat behaviour within the historical uptrend channel.
The head-and-shoulders pattern suggests a significant trend change rather than a correction. So where is the culprit that is spooking the S&P? Certainly tensions in the Ukraine and the potential for a spill-over conflict are weighing on the market. However, markets are generally bullish during conflict periods.
Often a major contributor to inflation is the erosion of monetary value. The US debt continues to grow and it’s financed by printing money. By some estimates, 80 per cent of all US dollars in existence were printed in the last 2 years. It grew from US$4 trillion in January 2020 to US$20 trillion in October 2021.
Whilst the exact quantum may be open to question, the general conclusion is incontrovertible, as is the inevitable contribution to inflation and the need to rapidly increase interest rates. Oil is a symptom, not a cause.
The writer is a financial technical analysis specialist, an equity and derivatives trader, and an author. He has developed several leading technical indicators used by investors in many markets.
Decoding Asia newsletter: your guide to navigating Asia in a new global order. Sign up here to get Decoding Asia newsletter. Delivered to your inbox. Free.
Copyright SPH Media. All rights reserved.