Gold displays volatile movements
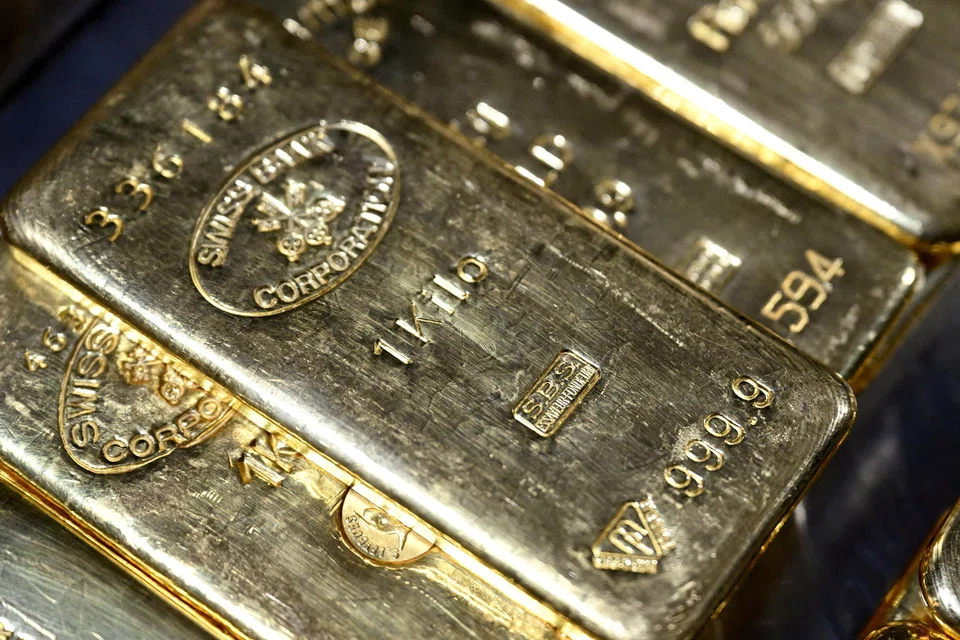
GOLD continued its rally in January, rising above US$5,500 an ounce to reach a new historical high having traded around the US$2,000 an ounce level in 2023. The rally was driven by the appearance of major global economic events, making gold lucrative as a form of hedge against inflation and currency devaluation.
Central banks have also continued to accumulate gold to hedge against their fiat currency reserves. At the start of 2026, gold prices soared more than 20 per cent to US$5,500. They subsequently pulled back with the nomination of Kevin Warsh as the new Fed chairman, amid expectations that his relatively hawkish stance could keep the central bank focused on controlling inflation. Prices later recovered back to US$5,200 as the US-Iran war escalated.
Gold then fell to around US$4,200 in March 2026 and slightly below US$4,000 in the later months after an initial ceasefire of the Iranian war. However, continued uncertainty surrounding the conflict encouraged hedge funds to seek gold as a form of diversification. CFTC data also reported that open interest of gold contracts held by hedge funds steadily increased from January 2026 until August 2026.
US interest rate and inflation
The Fed aims to bring down US inflation towards its long-term goal of 2 per cent. However, inflation has remained elevated above 3 per cent due to rising oil prices and disrupted supply chains from the Iranian war. The highest inflation rate recorded was in March 2026 at 4.2 per cent, around the same period that gold had once again traded above US$5,000.
The recent FOMC meeting in July 2026 concluded with the Fed maintaining the interest rate target at 3.5 per cent to 3.75 per cent. Warsh signalled his intention to reduce the Fed’s balance sheet and bond markets reacted by a steepening of the gap between short- and longer-term bond yields. Markets are pricing in a 60 per cent chance of a rate hike in the upcoming FOMC meeting.
US oil prices have also moved back towards levels seen during the earlier stages of the US-Iran conflict, rising above US$90 a barrel. Developments surrounding efforts to temporarily re-open the Strait of Hormuz would likely decide the outlook for energy-induced inflation.
Bearish gold scenario
Gold is trading below US$4,500 and is ranging around the 20-day moving average since the recent pullback. The 10-day moving average has just touched the 20 days and could cross below for a bearish signal. The first key support is at US$4,330 where buying interest previously emerged and pushed prices higher following a strong reversal from a bearish session. The next support can be found at the US$3,960 level, an area where prices ranged for almost a month. The stochastic indicator also points to a continuation of the pullback with the %K line crossing below the %D line.

The latest CFTC report showed a decrease in hedge fund long positions in gold, signalling an increase in selling activity, and possibly even profit-taking from the recent rally. With both the stochastic indicator and moving averages signalling the continuation of the pullback, a break below the US$4,330 level could expose the next support at around the US$3,960 level.
Bullish gold scenario
A bullish scenario for gold could emerge if US inflation rises, while markets continue to price in no further rate hikes from the Fed. Geopolitical risk also remains an important catalyst. A failure of peace talks to produce a lasting de-escalation of the Iran conflict could renew demand for gold as a safe haven asset.
From a technical perspective, the previous resistance and oversold level of the stochastic indicator was back in May 2026 at US$4,735. Buyers may look to go long above the US$4,330 level if price action confirms bullish momentum towards the US$4,735 and then US$4,845 levels.
The writer is contract for differences dealer
Decoding Asia newsletter: your guide to navigating Asia in a new global order. Sign up here to get Decoding Asia newsletter. Delivered to your inbox. Free.
Share with us your feedback on BT's products and services