Nasdaq weakens entering Q4 amid inflation concerns, earnings uncertainty

DeeperDive is a beta AI feature. Refer to full articles for the facts.
THE Nasdaq index experienced a decline alongside other major US indexes on Thursday (Oct 12), albeit still maintaining a positive outlook for the week. At this point of writing, if the week concludes on a positive note, it will mark the third consecutive week of gains for the Nasdaq.
Thursday’s downturn can be attributed to the release of the latest consumer price index (CPI) report, which unveiled persistent inflation figures, subsequently leading to increased bond yields. Furthermore, several financial firms were expected to disclose their third-quarter earnings on Friday.
These earnings reports are expected to be impacted by heightened capital requirements and the looming threat of a recession. In addition, ongoing geopolitical tensions and the Israel-Hamas conflict pose potential risks to global oil supply and prices, although their direct impact has not yet materialised.
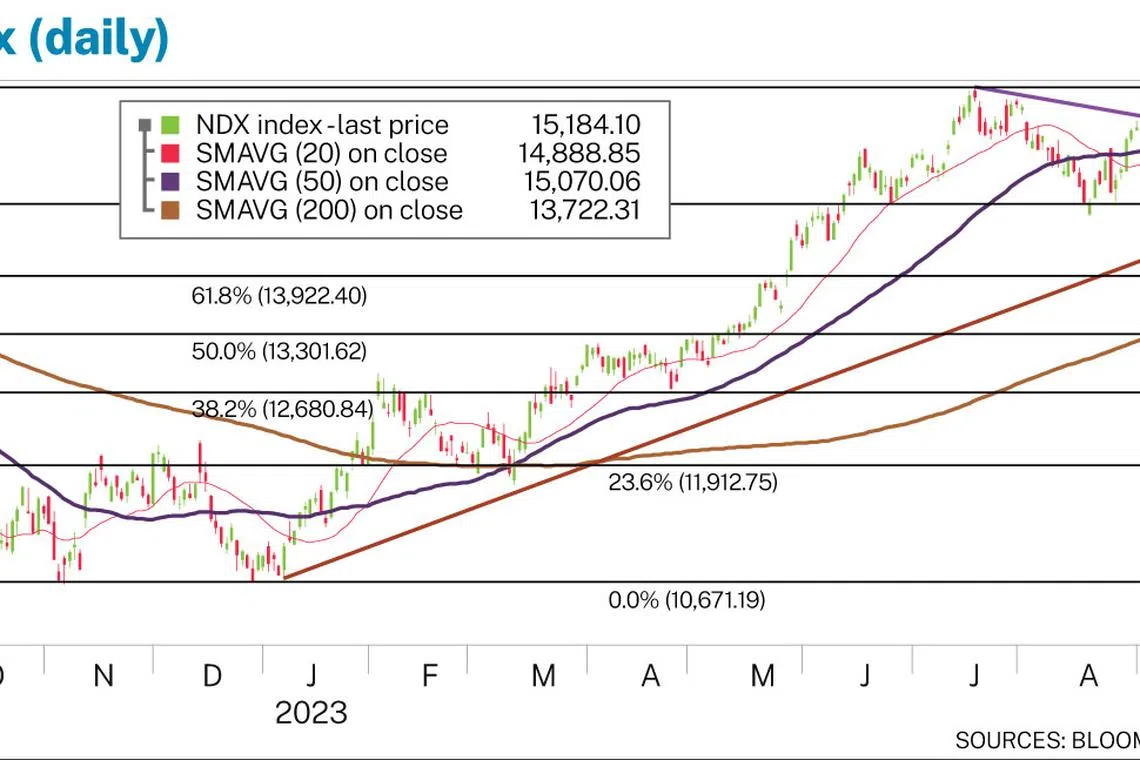
Bullish scenario
The Nasdaq remains underpinned by an extended uptrend line that has been in place since the beginning of 2023. The index has managed to stay above this uptrend line, with the 76.4 per cent Fibonacci level at 14,690 acting as near-term support.
Notably, the Nasdaq has breached both the 20-day and 50-day simple moving average (SMA) levels, indicative of short-term strength. Potential upside may materialise if the index overcomes resistance around the 15,930 region, representing the high point of July 2023.
Bearish scenario
There is a stronger likelihood of the short-term downtrend to persist, extending from July to the present. The Nasdaq recorded a lower low between August and October, with the 20-day SMA level falling below the 50-day SMA level in August. As of the current index level, the 20-day SMA remains beneath the 50-day level. The Nasdaq was also repelled by resistance at the downtrend line on Thursday, hinting at the continuation of the downtrend.

Navigate Asia in
a new global order
Get the insights delivered to your inbox.
The near-term support has been established at the 76.4 per cent Fibonacci level, followed by a support zone encompassing the 200-day SMA level at 13,720 and the 61.8 per cent Fibonacci level of 13,920. There is a likelihood of a retracement near the initial support, and a failure of this level could signify the initiation of a more sustained downtrend, thereby confirming the breach of the uptrend line.
The writer is senior investment specialist at Phillip Securities
Decoding Asia newsletter: your guide to navigating Asia in a new global order. Sign up here to get Decoding Asia newsletter. Delivered to your inbox. Free.
Copyright SPH Media. All rights reserved.
TRENDING NOW

Shelving S$5 billion office redevelopment plan proved ‘wise’ as geopolitical risks mount: OCBC chairman

OCBC is said to emerge as lead bidder for HSBC Indonesia assets

Middle East-linked energy supply shocks put Asean Power Grid back in focus

Eurokars Group introduces rental car franchises Enterprise Rent-A-Car, National Car Rental, and Alamo to Singapore