

Mixed signals from gold and the Magnificent Seven stocks

MANY investors contemplate riding along with the Magnificent Seven stocks, while others have found new delight in the performance of gold.
This is an important contradiction because gold is usually a hedge against economic risk. When investors worry about the economy, they turn to gold. That in part explains why the price of the commodity has, since 2020, spent so long in a sideways movement.
On the other hand, the S&P 500 has powered ahead, catching even the most experienced analysts by surprise. The eight largest financial managers in the US failed miserably to correctly forecast the index’s performance in 2023 – it added 26 per cent. But Wells Fargo, reportedly the best of forecasters, expected a miserable 12 per cent increase for the period, while Barclays predicted a fall of 4 per cent.
However, despite the astounding rise in 2023 which has continued this year, the situation is not as strong as it appears. The rise is driven by the Magnificent Seven stocks – Apple, Amazon, Alphabet, Nvidia, Meta, Microsoft and Tesla. Remove these seven from the S&P 500 Index, and the rate of growth is reduced to 6 per cent.
This underlying modest level of growth accounts for the seemingly contradictory rise in the gold price. The other factor to consider is the increase in Chinese gold-buying in 2023 and 2024. Additions to China’s gold reserves can only be guessed at, but purchases seem to be regular and substantial.
For China, gold is a hedge against further economic attacks by the US. The reserves are also a foundation for the digital yuan and the move away from the US dollar-denominated cross-border trade settlement system. De-dollarisation underpinned by gold reserves has the potential to create a powerful alternative to the US dollar.
Although narrowly based on seven stocks, the S&P 500 shows no signs of trend collapse. The index had a trend pause in mid-2023, when a shallow head-and-shoulder pattern pointed to a stumble. The rebound from this, which began in October, is the anchor point for the new uptrend.
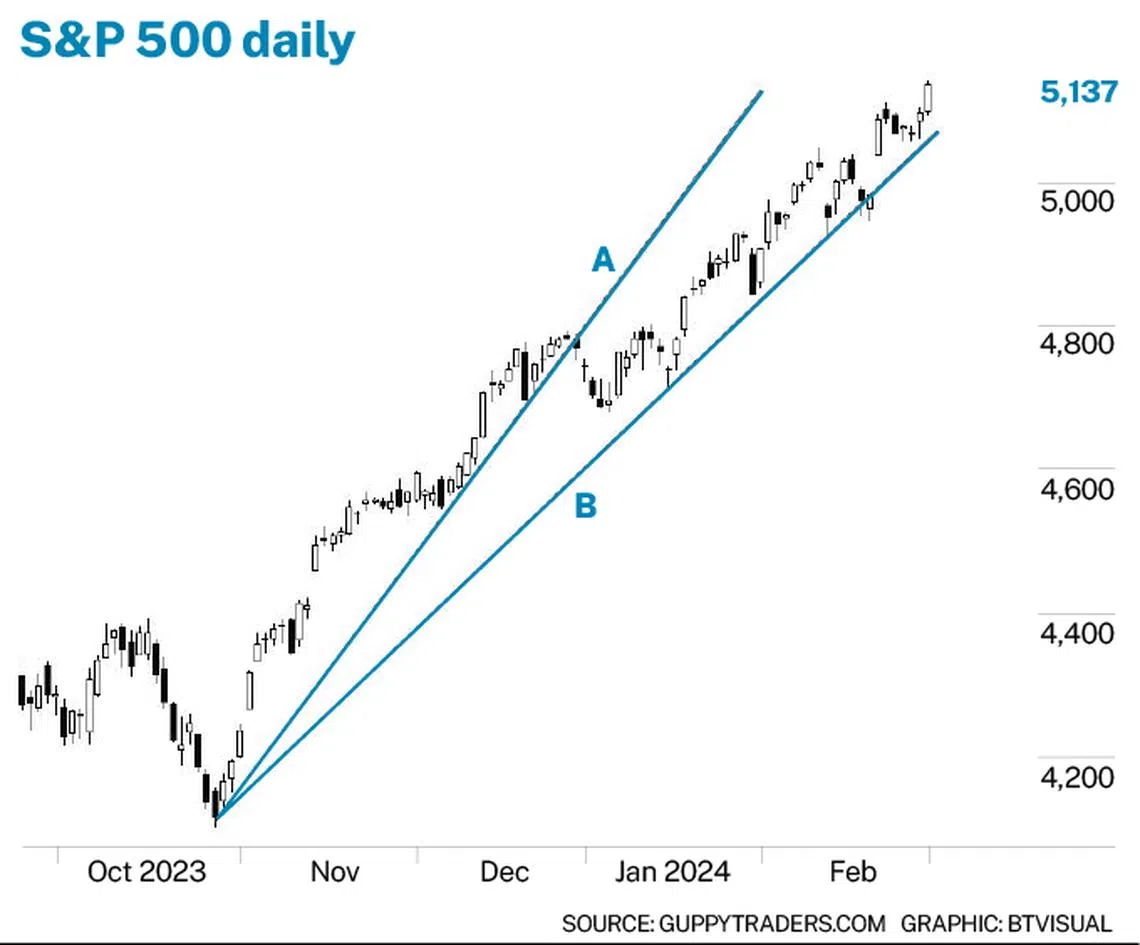
In the chart, the initial rise is defined by trend line A. This line was broken in December 2023, and the mild retreat was quickly followed by a bounce. The subsequent index action is identified by trend line B.
Trend line A will act as a resistance level, and trend line B as a support feature. Currently, the index is hugging the lower trend line B, but any fast rally will encounter resistance from the value of trend line A.
This expanding wedge is often associated with a long-term trend reversal, so astute investors will be on the alert for any other signals which confirm a developing trend weakness. The head-and-shoulder trend reversal pattern is a characteristic behaviour of the S&P 500. There are currently no signs of this pattern development.
On the alert for trend weakness
The breakout in the gold price delivers hope to the enduring and ever-hopeful gold bugs. Since 2020, gold has been in a broad trading range between US$1,700 and US$2,145. The range provided good trading opportunities with a 26 per cent return from the bottom to the top of the trading band.
The breakout above US$2,145 has gold bugs excited, since this level has been tested successfully several times, developing a base for the new upside rally and trend development. This is the hope held by gold bugs.
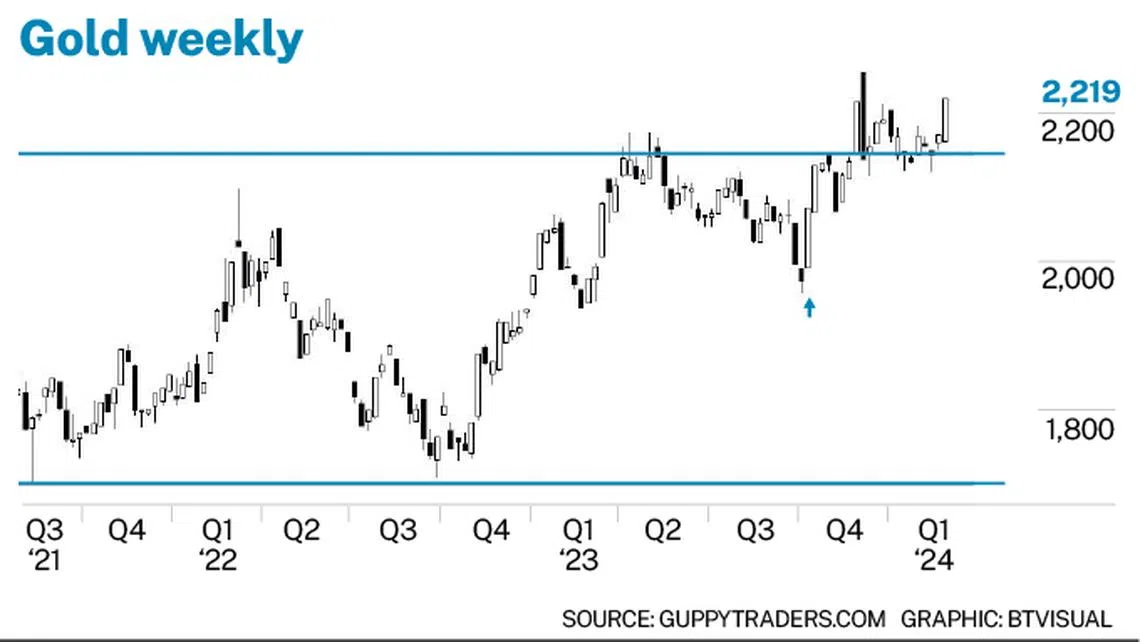
Trading bands are a useful tool because they can be used to set targets when the price moves beyond the limits of the band. The gold trading band is wide by US$445. This value, projected upwards from the upper edge of the trading band, gives an upside target near US$2,590.
This is a significant rise, but it’s useful to remember that this is a long-term projection, even though in 2020, the gold price took just four months to rise from the bottom to the top of what became the current trading band.
As shown by the arrow, the gold price jumped following the Hamas attack in October. This rally response has developed into a more stable uptrend. A move above the previous high at US$2,253 will be a bullish signal for a new longer uptrend development. A sustained fall below US$2,145 suggests it’s time to back the Magnificent Seven and the S&P 500.
Both the S&P 500 and gold offer investment opportunities. But the contradiction in behaviour suggests that investors should look out for any evidence of trend weakness.
The writer is a financial technical-analysis specialist, equity and derivatives trader, and author. He has developed leading technical indicators used by investors in many markets.
TRENDING NOW

Grab CEO’s wife Chloe Tong on life with Anthony Tan and finding her purpose

What role can Japan play in Asean’s future?

He built the Vingroup empire. Now South-east Asia’s richest man is handing some key roles to his sons

Asean’s challenge is to become resilient against global geopolitics: former Indonesia trade minister

