What’s behind markets that refuse to rise

OIL, like the Shanghai market, refuses to rise. As tensions in the Middle East and the Strait of Hormuz ratcheted up, the price of oil has retreated from a high of around US$79 to US$74, just a little above the December lows of about US$68.
Meanwhile, on the other side of the globe, the China market at first reacted strongly to a relatively minor change in bank lending conditions, before resuming its long-term decline. It wasn’t helped by the Evergrande judgement, but it was always going to take more than government instructions to the banks to stop this long-term downtrend.
The refusal to rise raises two questions for these markets. Is there an inevitable rally and trend reversal in either of these markets?
A rise in the oil price has an inflationary impact and a consequent negative hit on global economic recovery. Despite the fear, the price remains at around the midpoint of the price range over the past three years. Due to the strong trading bands, there are sound reasons why price constraints will continue to apply. A rise in the China market signals an expanding economy with an inevitable boost to the global economy, although not all will welcome a return of this competition. Unlike oil, the Shanghai Composite Index is touching multi-year lows not seen since 2016 and 2019. The key question here is not about constraint, but about how much further this market could fall.
The Relative Strength Indicator (RSI) divergence pattern is a key indicator of trend reversal when applied to the Shanghai Composite Index.
It is constructed by plotting a trend line connecting two low points on the Shanghai index. On the RSI display, a trend line is also placed connecting the low points or price plunges on the RSI indicator.
Navigate Asia in
a new global order
Get the insights delivered to your inbox.
A strong divergence is when the trend line on the RSI indicator moves in the opposite direction to the trend line on the index chart. This is a rising RSI trend line at the same time that there is a falling trend line on the index chart.
Currently, the Shanghai index shows a weak divergence pattern where the thick trend line on the RSI indicator is flat and the trend line on the index chart is sloping downwards. This suggests that any new uptrend breakout is weaker. The resistance levels near 2,925 and 3,075 will be significant barriers to any market recovery.
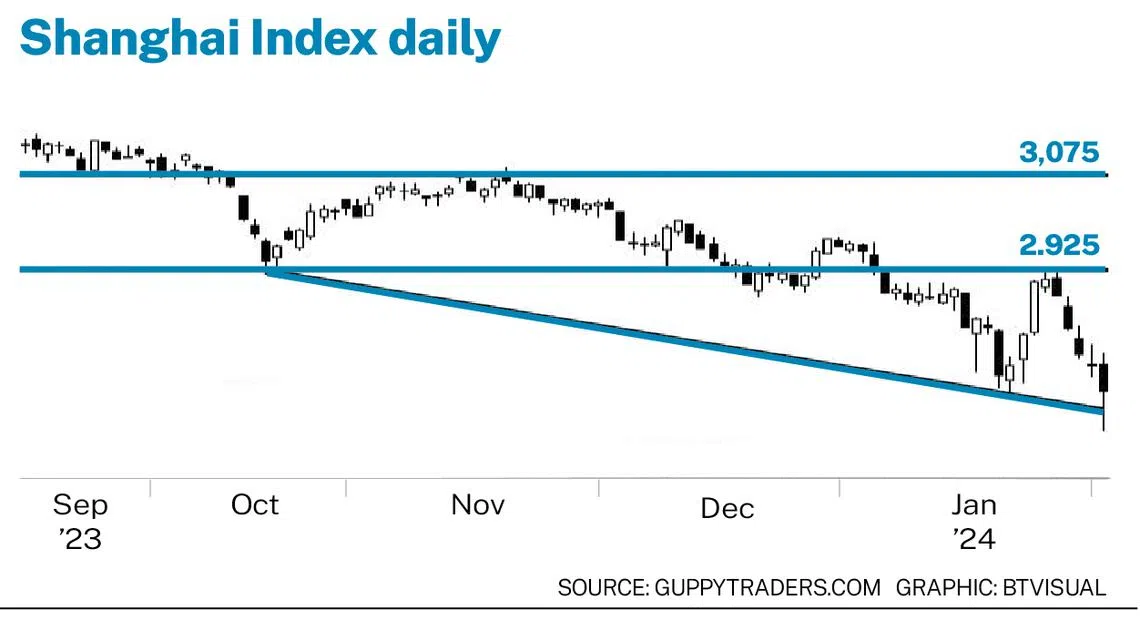
The Shanghai index could retest the recent lows. Any change to an uptrend will be a slow and difficult process. The behaviour of the market from October to November 2022 is a guide to how this market may behave.


A failure of support around current lows has the potential for the index to retest the 2013 lows near 1,850.
Oil is nowhere nearly as bearish as the China market. Despite world-shaking events, the oil market remains unperturbed and continues to trade within a well-defined band. This trading band has defined the market activity since the end of 2020. The Russia-Ukraine war caused a three-month price spike, but prices then returned to sedate trading within the band.
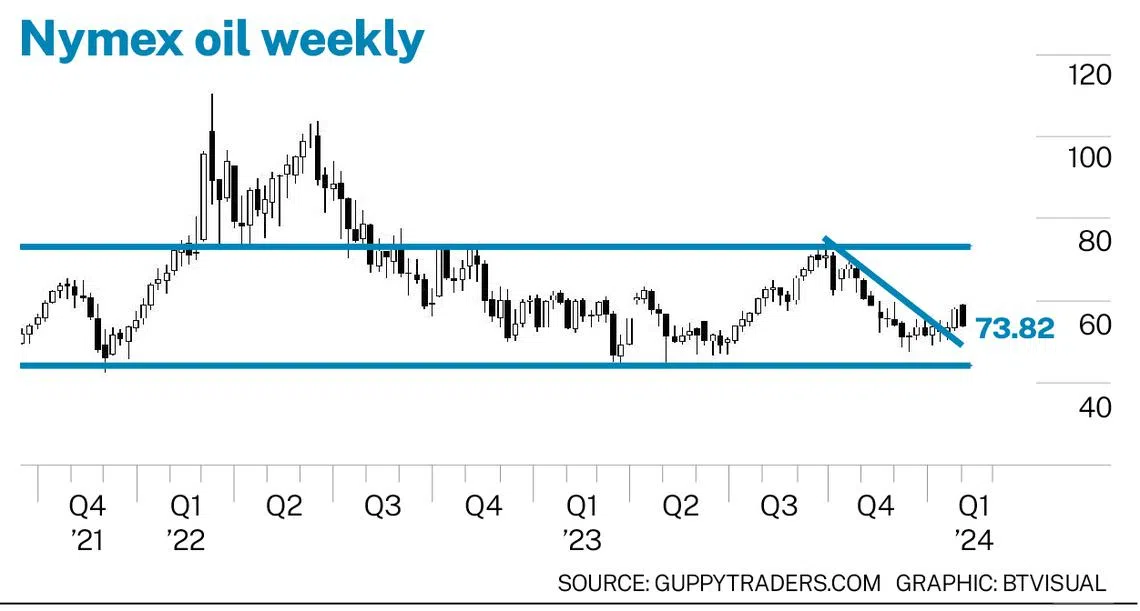
The lower edge of the trading band is near US$65. The upper edge is near US$95. There are good profits of 45 per cent to be made trading between the edges of the trading band. However, this sideways trading pattern shows little preference for breaking out into a significant new trend, be it up or down.
Oil is content to trade in restrained short-term rallies and retreats. Despite a disorderly world, it shows a restrained and orderly trading pattern.
The breakout above the short downtrend has an upside target near US$95. When achieved, this has a high probability of developing into a new downtrend with a target near US$65.
In defiance of global unrest, the oil market is going nowhere. The Shanghai index is struggling to lift itself off the floor and in many ways, this offers better investment opportunities. It has, as Warren Buffett would say, many good companies trading below value and with attractive prices.
The writer is a financial technical-analysis specialist, equity and derivatives trader, and author. He has developed leading technical indicators used by investors in many markets
Decoding Asia newsletter: your guide to navigating Asia in a new global order. Sign up here to get Decoding Asia newsletter. Delivered to your inbox. Free.
Copyright SPH Media. All rights reserved.